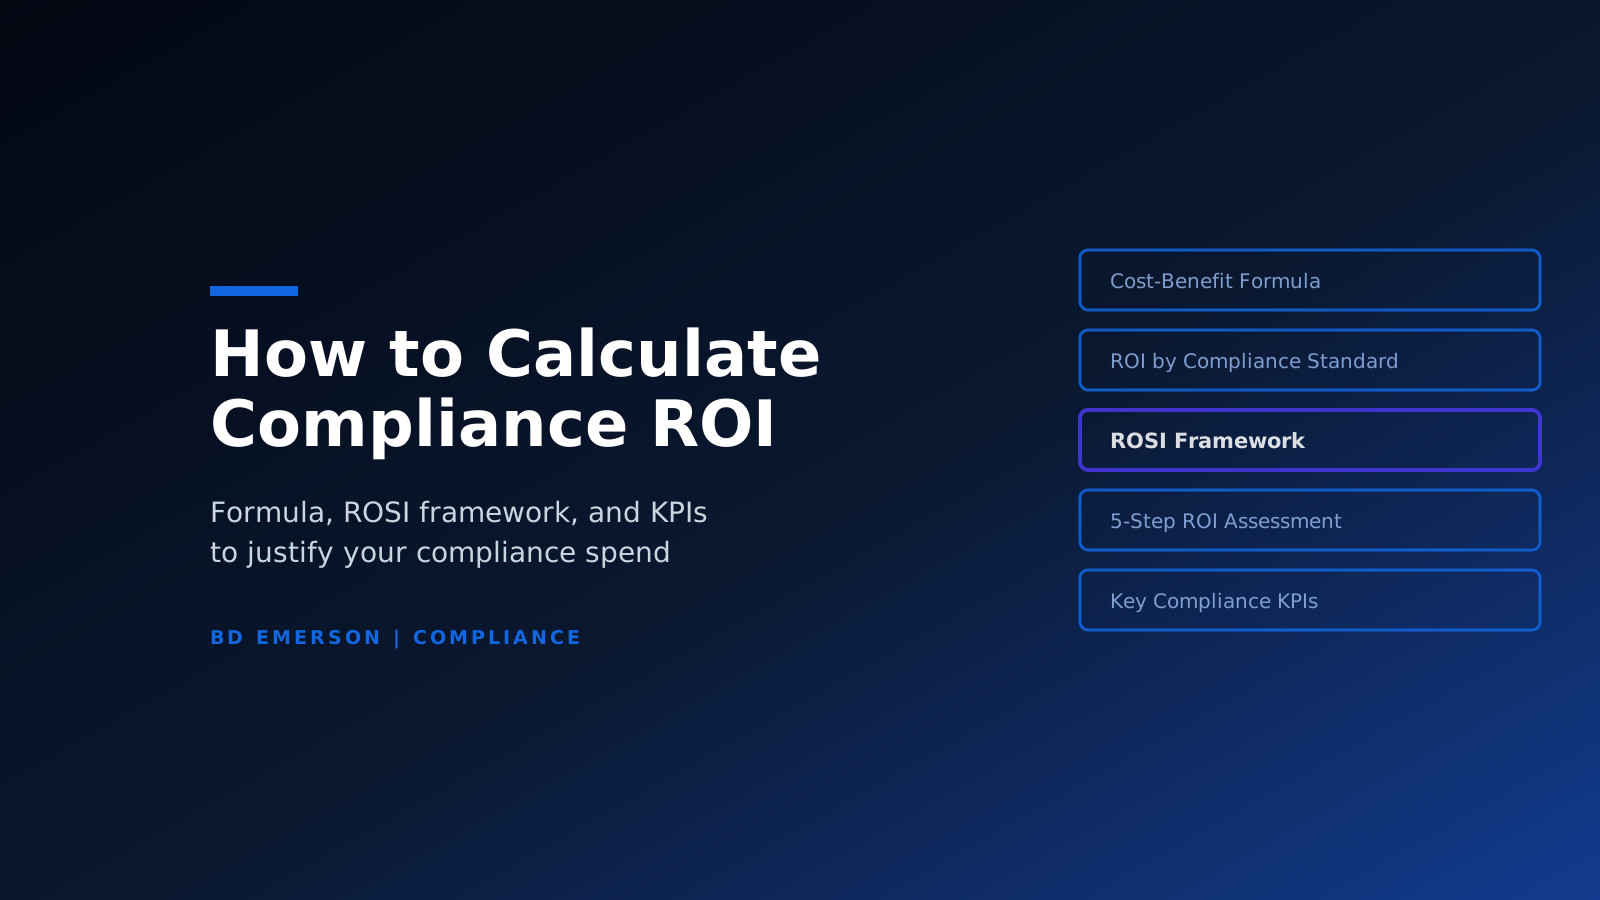
How to Calculate Compliance ROI: A Practical Framework
A compliance budget has to answer what every budget line answers: what does it return? That is harder here, because part of the return is money never spent, and money never spent is harder to evidence than money received: the penalty nobody had to pay, the incident that never reached your customers, the deal that closed without stalling in a security review. Compliance ROI is the measurable financial return from investing in regulatory and framework requirements, including penalties avoided, breach costs prevented, and business that certifications unlock. Below: the core formula, every benefit category that belongs in it, how the calculation changes across SOC 2, ISO 27001, HIPAA, NIST and GLBA, and a five-step process for turning it into a number you can take to your CFO or board.
Key takeaways
- Compliance ROI has three measurable components. Losses avoided, revenue unlocked, time reclaimed. Counting only avoided penalties understates the return and undercuts the business case.
- Every input needs a documented source. Risk-based cost avoidance takes a cost-of-incident figure and an annual probability of that incident before and after your controls. Inputs built on assumption will not survive a CFO review.
- ROI looks different by framework. SOC 2 returns through enterprise sales acceleration; ISO 27001 through insurance savings and market access; HIPAA through penalty avoidance and breach notification cost prevention.
- Baseline before you launch. Without your open findings count, audit cost per control and time-to-remediation captured before day one, there is no delta to report.
- Present a range, not a single figure. A conservative, base and optimistic scenario is more credible to a board than a precise number built on uncertain probabilities.
What Is Compliance ROI? Definition and Benefit Categories
Compliance ROI measures the financial return your organization generates from regulatory and framework requirements. It distributes across three categories: risk reduction (losses avoided through penalty prevention and breach cost mitigation), revenue enablement (business unlocked by certifications and market access), and operational efficiency (time and cost recovered as controls mature and manual work is systematized).
What distinguishes compliance ROI from a standard business ROI calculation is that one of those categories, risk reduction, measures outcomes that did not happen, and is therefore the hardest of the three to put a number against. Quantifying prevented losses requires probability-based risk modeling alongside the direct cost and revenue accounting a finance team already performs.
Skipping that modeling step drops risk reduction from the numerator entirely: an assessment that counts insurance savings and sales acceleration but not breach cost prevention measures only the part of the return that reaches accounting records.
Why Compliance ROI Is Difficult to Quantify
The standard business ROI formula measures what you gained against what you spent, and compliance does not fit it cleanly: an event that never happened leaves no invoice and no date on a calendar. Proving the value of prevented outcomes takes a different approach from proving the value of a product launch.
Two types of compliance value compound the challenge. Cost avoidance is quantifiable only by estimating the probability and cost of adverse events, then how much your program reduces that exposure. Growth enablement, the revenue and market access certifications unlock, is harder to see on a balance sheet but no less real, and a calculation that stops at cost avoidance misses it entirely.
The Core Formula: How to Calculate Compliance ROI
Compliance ROI (%) = (Total Compliance Benefits − Total Compliance Costs) ÷ Total Compliance Costs × 100
What to Include in Compliance Costs
The costs side is the straightforward half. Include every dollar and hour you spend on compliance, across five categories:
- Internal labor. Hours spent on gap assessment, policy writing, control implementation, evidence collection, and audit preparation, multiplied by your fully burdened hourly rate.
- External consulting and advisory fees. Implementation partners, vCISO services and pre-audit readiness advisors.
- Certification and audit fees. The audit or assessment itself, including surveillance and recertification audits in the cycle.
- Technology. Compliance automation platforms, GRC tools, monitoring software, and security tooling bought to meet control requirements.
- Training. Security awareness programs, role-specific training, and certifications required for the compliance team itself.
What to Include in Compliance Benefits
Benefits fall into three categories. Counting only the first leaves two thirds of the framework out of the numerator.
Category 1: Losses avoided (hard-dollar savings)
These are direct savings that reduce operating costs or protect against defined exposures:
- Reduced audit fees over time. Audit effort tracks how ready your evidence is, so systematized evidence collection can shorten later audits. If your first SOC 2 Type 2 audit required 80 hours of auditor time and your second required 60, that reduction is a real saving.
- Lower cyber insurance premiums. Carriers underwrite on the controls you can demonstrate, and our guide to new cyber insurance requirements covers what they now ask for. The ISO 27001 section below shows how to turn that into a figure.
- Avoided regulatory fines. Penalty structures differ enough that one regime is a poor guide to another, so read the one that applies to you and verify current amounts with the regulator. Then set your modeled exposure against program cost rather than assuming the ratio is favorable.
- Prevented breach costs. According to IBM's 2026 Cost of a Data Breach Report, the global average cost of a data breach reached $4.99 million. Your sector and your own exposure will move this figure, so treat it as a starting point rather than as your number. A program that reduces breach probability creates a proportional avoidance benefit, calculated in the ROSI section below.
Category 2: Revenue unlocked (growth-dollar benefits)
- Enterprise sales acceleration. Where enterprise procurement makes a SOC 2 report or an ISO 27001 certificate a vendor qualification condition, compliance documentation becomes a revenue gate. Count the total annual contract value of the deals in your pipeline that carry that condition.
- Market access. Where a buyer or a public tender makes ISO 27001 certification or NIST alignment a condition of award, the credential puts the segment in reach. The value is the revenue available there multiplied by your realistic win rate.
- Reduced sales cycle friction. Replacing a security questionnaire cycle with a standard SOC 2 report exchange shortens sales cycles, and shorter cycles mean faster revenue recognition even when contract value is unchanged.
- Reputational standing and competitive differentiation. Where buyers weigh security posture in vendor selection, a current certification or attestation reduces friction beyond the deals that formally require it. It resists a precise dollar figure, so carry it in the assessment as a named qualitative benefit rather than a line in the numerator.
Category 3: Time reclaimed (operational efficiency)
- Eliminated manual compliance tasks. Where automation takes over evidence collection your team was doing by hand, multiply the hours saved per year by their fully burdened hourly rate.
- Reduced incident management overhead. Fewer security incidents translate to fewer hours spent in triage, breach notification preparation, and post-incident remediation.
Return on Security Investment: Using the ROSI Framework for Compliance
The Return on Security Investment (ROSI) framework, as set out in ENISA's Introduction to Return on Security Investment, translates compliance controls into expected financial outcomes. It suits CFO and board reporting because it expresses your program's value as a dollar figure tied to named risk scenarios rather than as assurance that controls are in place. The sequence below builds that calculation from the ground up and closes on the input that decides the result.
Define the Inputs for Your ROSI Calculation
Define each input explicitly and document the source for each figure before running any arithmetic:
- Single Loss Expectancy (SLE). The cost of one occurrence of the risk event: for a breach, incident response, notification, regulatory response, legal fees, and business disruption. IBM's 2026 global average of $4.99 million can anchor it, but your SLE should reflect your own data footprint and exposure.
- Annual Rate of Occurrence (ARO) before controls. The probability that the event occurs in a given year with your current controls. A 20% annual probability is an ARO of 0.20; a once-in-ten-years event is an ARO of 0.10.
- ARO after controls. The same probability once the controls your program implements are active.
- Program cost. Your total compliance investment, from the five cost categories above.
Calculate Annual Loss Expectancy (ALE)
Annual Loss Expectancy is the expected dollar value of a specific risk over twelve months, the product of the two inputs above:
ALE = Single Loss Expectancy (SLE) × Annual Rate of Occurrence (ARO)
Run it twice: with your ARO before controls, which is the risk you carry today, and with your ARO after.
Calculate ROSI
With ALE for your key risk scenarios in hand, you can calculate the return your compliance program delivers.
ROSI = (ALE Before Program − ALE After Program − Program Cost) ÷ Program Cost
A positive ROSI means the program generates more value in risk reduction than it costs. A ROSI of 1.5 means every dollar invested returned $1.50 in expected loss reduction above and beyond the cost of the program itself.
Use Documented Risk Data for ARO
ALE is the product of the two inputs, so doubling either doubles the answer: an ARO of 0.20 instead of 0.10 does what an SLE twice the size would. What separates them is how each is evidenced. An SLE is assembled from costs you can price; an ARO is a probability somebody has to assess, and an estimate drawn from memory or an internet search will not survive a CFO asking how it was derived.
ARO should come from a documented risk assessment with a named methodology. If you have never run one, the ROSI calculation is an argument for doing so, not a reason to invent a number. A board that asks "how did you arrive at that probability?" deserves a methodology reference, not a confidence assertion.
ROI by Compliance Framework
The ROI profile differs by the framework you are building for. If you are still deciding which ones apply, our cybersecurity compliance guide covers the landscape.
SOC 2 Compliance ROI
SOC 2 suits revenue-side ROI calculations because its purpose is demonstrable: the report exists to give enterprise buyers confidence in your security posture, and that confidence has commercial value.
Start with your sales pipeline and identify the deals where a SOC 2 report was required, requested, or would have materially shortened the security review. The total annual contract value of those deals is your primary benefit pool; set it against your SOC 2 investment from the cost side. A secondary benefit is time returned on security questionnaires: where your team handles a steady volume of vendor reviews, replacing them with a report exchange is a saving in hours multiplied by burdened rate.
See the full cost breakdown, including audit fees, readiness work, and tooling, in our guide to SOC 2 compliance costs.
ISO 27001 Compliance ROI
Two value drivers carry the ISO 27001 calculation: insurance premiums and international market access.
For insurance, the calculation needs before-and-after quotes from the same insurer, or comparable market quotes, tied to your certification. Ask your broker whether it moves you into a lower-risk tier; where it does, the annual delta is a recurring saving that compounds over the certification lifecycle. Our guide to saving on cyber insurance covers the control evidence carriers look for.
For market access, the value depends on which contracts, regions or segments the certification opens. If it enables a contract you could not otherwise bid for, the investment can be recovered in that one engagement.
Read our ISO 27001 certification cost guide for a full breakdown of the investment across the first three-year cycle.
HIPAA Compliance ROI
HIPAA ROI is driven primarily by penalty avoidance and breach notification cost prevention. The Office for Civil Rights enforces civil monetary penalties on a tiered structure based on culpability and knowledge (45 CFR 160.404), and penalties can accumulate across multiple violations arising from a single incident, subject to an annual cap for identical violations that is adjusted each year. Once that exposure is modeled with documented probabilities, a structured HIPAA compliance investment can be justified on a penalty-avoidance basis alone.
The second benefit category is breach notification cost avoidance. Under the HIPAA Breach Notification Rule, a breach of protected health information triggers notification to affected individuals, to the Department of Health and Human Services, and, for breaches affecting more than 500 residents of a State or jurisdiction, to prominent media outlets serving that State or jurisdiction (45 CFR 164.406). Those notifications, credit monitoring and post-breach remediation carry costs that a program reduces by reducing the probability of breach in the first place.
NIST and GLBA Compliance ROI
NIST compliance ROI for organizations pursuing federal contracts is primarily about eligibility, and which standard applies depends on the information you handle. Federal contractors safeguard federal contract information under FAR 52.204-21, and where they process, store, or transmit controlled unclassified information they implement the controls in NIST SP 800-171. Where a defense contract carries the CMMC clause, that control implementation must be demonstrated through the assessment type the required status calls for, from a self-assessment to a third-party or government assessment, chosen by the requiring activity according to which type of information is involved (32 CFR 170.3). As those requirements phase into solicitations, an organization that cannot meet the status a contract names is out of the running regardless of technical capability. The value of NIST compliance is therefore the federal contract pipeline it opens: addressable contract value multiplied by your realistic win rate.
GLBA compliance for financial institutions is enforcement-driven rather than penalty-driven. The FTC's Safeguards Rule, issued under the GLBA, requires covered financial institutions to develop, implement, and maintain an information security program with safeguards designed to protect customer information. Non-compliance exposes institutions to FTC enforcement action and state-level regulatory consequences, so the ROI case here rests on the cost of an enforcement process and of remediation under order, not on a published penalty schedule.
A 5-Step Compliance ROI Assessment
This process turns the formula into a repeatable assessment: run it before launch, update it annually.
1. Baseline Your Current Risk Exposure
Document your starting point before any investment begins: the number and severity of open findings from your most recent assessment, your exposure to each framework's penalty structure (qualitative is fine at this stage), and any incident or near-miss data from recent periods. This baseline is the "before" state in your ROSI calculation and the reference point for every delta you report later.
2. Map Your Full Compliance Investment
Build a twelve-month projection across the five cost categories: internal labor at fully burdened rate, external consulting and audit fees, tooling subscriptions, certification fees, and training. This total is your denominator, and underestimating it is a common way projections fail under scrutiny.
3. Quantify Your Top Three Risk Scenarios
For each of your three highest-exposure risk scenarios, estimate your SLE and your ARO before and after the program. With no incident cost of your own to work from, start the breach scenario at IBM's $4.99 million 2026 global average and adjust it for your data footprint and customer base. Document every assumption: who provided the probability estimate, what risk assessment methodology supports it, and when you will revisit it.
4. Add Operational Efficiency Gains
Identify the manual tasks your program automates or eliminates, estimate hours saved per year and multiply by fully burdened rate. Add the premium delta from the ISO 27001 section and reduced audit fees where prior periods support them. Each is a hard-dollar saving for your numerator.
5. Build a Conservative, Base, and Optimistic ROI Range
Apply your assumptions from Steps 3 and 4 across three scenarios: conservative, with the most pessimistic probabilities and the lowest plausible benefits; optimistic, with the highest defensible inputs; and base, splitting them at your best estimate. Present all three. A range signals that you understand the uncertainty in the inputs, and it is more credible than a single figure that looks more precise than the data supports.
Key Metrics to Measure Compliance ROI
Measuring compliance ROI is not a one-time event at audit completion. We treat the assessment as a working document: the baseline from Step 1, the investment register from Step 2, the three risk scenarios with their assumptions, and the KPI set below, revisited quarterly so each year shows the projection and the actual delta against baseline.
Before launch:
- Open findings count and severity distribution. Outstanding issues from your most recent assessment: your risk posture baseline and the "before" state in the ALE recalculation as controls come online.
- Time-to-remediation. Average days to close a finding. Improvement shortens the window in which you carry elevated exposure.
- Audit cost per control. Total audit fee divided by controls in scope. It falls as evidence collection becomes systematic, so tracking it annually shows efficiency gains in dollars.
- Cyber insurance premium. The premium figure on your current policy, with its date. It is the one benefit in the model that needs no probability estimate.
- Training completion rate. The proportion of your workforce with current security awareness training at the start. Watch whether rising completion tracks falling incident frequency in your own data, which makes it a leading indicator for the time-reclaimed category.
On an ongoing basis:
- ALE by risk scenario. Recalculate at least annually with updated ARO estimates. A declining trend shows the controls delivering the risk reduction you projected.
- Sales cycle length for compliance-gated deals. Time from first contact to signed contract where a compliance report is part of the security review. Reduction over time is a revenue-side ROI metric.
- Security questionnaire volume. Manual vendor questionnaires completed per quarter. As the report replaces manual responses this should fall, and the hours saved feed the time-reclaimed category.
Record the value and the date for every metric, so a later calculation shows a real before-and-after delta rather than a directional estimate.
The Cost of Non-Compliance
Every compliance ROI figure has a counterpart: what the same twelve months cost if the program does not happen. That is the cost of non-compliance, and it is built from the same inputs you have already gathered.
- Unmitigated ALE. Your current Annual Loss Expectancy with today's controls, before the program reduces the probability of the incident. This is the line a board recognizes as a material risk.
- Modeled penalty exposure. The regulatory exposure from Step 1, against the frameworks that apply to you, with tiers kept qualitative where amounts adjust annually.
- Blocked revenue. The annual contract value of deals and segments out of reach without the certification or attestation the buyer asks for.
- Remediation under pressure. Building the same controls after an incident or a failed vendor review, when someone else sets the timeline and the work carries premium rates.
This total beside the ROI figure reframes the compliance budget from a line item into a risk decision, which is the framing that survives budget cuts.
Presenting Compliance ROI to Leadership
The underlying numbers are the same for every audience. What changes is the emphasis and the framing.
- CFO. Lead with cost avoidance and the insurance premium delta. CFOs respond to numbers they can reconcile against specific budget lines. Your conservative ROSI scenario, with assumptions documented, is the right format, set against the non-compliance total from the section above.
- CEO. Lead with market access and revenue unlocked: the annual contract value of pipeline deals that require a report or certification, and the contract value in the segments the credential opens. That translates compliance into outcomes the CEO already tracks.
- Board. Lead with breach risk as an annual dollar exposure. Your unmitigated ALE set beside your post-program ALE shows both the problem and the measured improvement, in the language of fiduciary oversight.
Common Mistakes When Calculating Compliance ROI
- Counting only hard-dollar costs while omitting risk-based avoidance. Penalty avoidance and breach prevention get dropped because they feel uncertain. Uncertainty is a reason to build a range, not to leave the numerator incomplete.
- Using industry averages without adjusting for your risk profile. IBM's $4.99 million figure is a global average. Applied unchanged to a 40-person SaaS company and a 5,000-person healthcare system, it produces two equally meaningless numbers.
- Measuring ROI only at audit time. A point-in-time calculation says nothing about improvement. Track KPIs quarterly and recalculate annually against the same baseline.
- Failing to set KPIs before the program starts. A reduction in open findings or time-to-remediation cannot be claimed against numbers nobody wrote down.
- Presenting a single figure to the board. A single number built on uncertain probability inputs is harder to defend than a documented range. A board member who asks how you arrived at it should get the risk assessment behind it.
FAQ
What counts as a good return on a compliance program?
There is no benchmark, because a benchmark would need benchmark inputs and every input here is organization-specific: your penalty exposure, your breach cost, your deal pipeline, your audit scope. A published figure from another company describes their inputs, not yours. The test we apply instead is whether the conservative scenario, on defensible assumptions, still covers the full program cost. In front of a CFO that beats a large number with a thin methodology behind it.
How long does it take for a compliance program to pay for itself?
The timeline varies by benefit category. Revenue-side return, deals unlocked by a SOC 2 report, can arrive within the first attestation cycle where your pipeline holds enterprise buyers who require it. An insurance premium change can only show up at your next renewal. Risk-based avoidance accumulates from the moment controls are active but is verifiable only in retrospect, through reduced incident frequency or updated scenario analysis.
What is the difference between compliance ROI and security ROI?
Compliance ROI measures the financial return from meeting regulatory and framework requirements: the penalties you avoid, the certifications and attestations you earn, and the business they enable. Security ROI measures the return from reducing the probability and impact of incidents more broadly. The two overlap, because a program that implements strong controls improves both. But a program that earns its certification or attestation without meaningfully improving the controls delivers the compliance return without the security one, which is why we recommend measuring them separately.
Conclusion
Compliance ROI is measurable, but only if you count all of it. An assessment that captures avoided penalties while omitting insurance savings, sales acceleration and operational efficiency understates the program's value and fails to make a durable case.
The framework above holds up to scrutiny from a CFO, CEO or board: the three benefit categories named before the program launches, baseline metrics captured on day one, risk reduction expressed in dollars through ROSI and tied to documented probabilities, and a range you return to annually as your controls mature.
These calculations fail in two ways: counting too little, dropping whole categories because the math feels uncertain, or counting inaccurately, applying industry averages without adjusting for your own risk profile. Both produce numbers that do not survive a CFO question. The process above is designed to avoid both.
Ready to Build a Compliance Program with Measurable ROI?
BD Emerson offers professional Cybersecurity Compliance Services across SOC 2, ISO 27001, HIPAA, NIST, and GLBA, with bespoke compliance advisory and continuous monitoring to help your organization reach and hold a compliance posture that is continually assessed. Contact us today.

About the author