Customer Concentration Risk: How Buyers Measure It, Price It, and Protect Against It
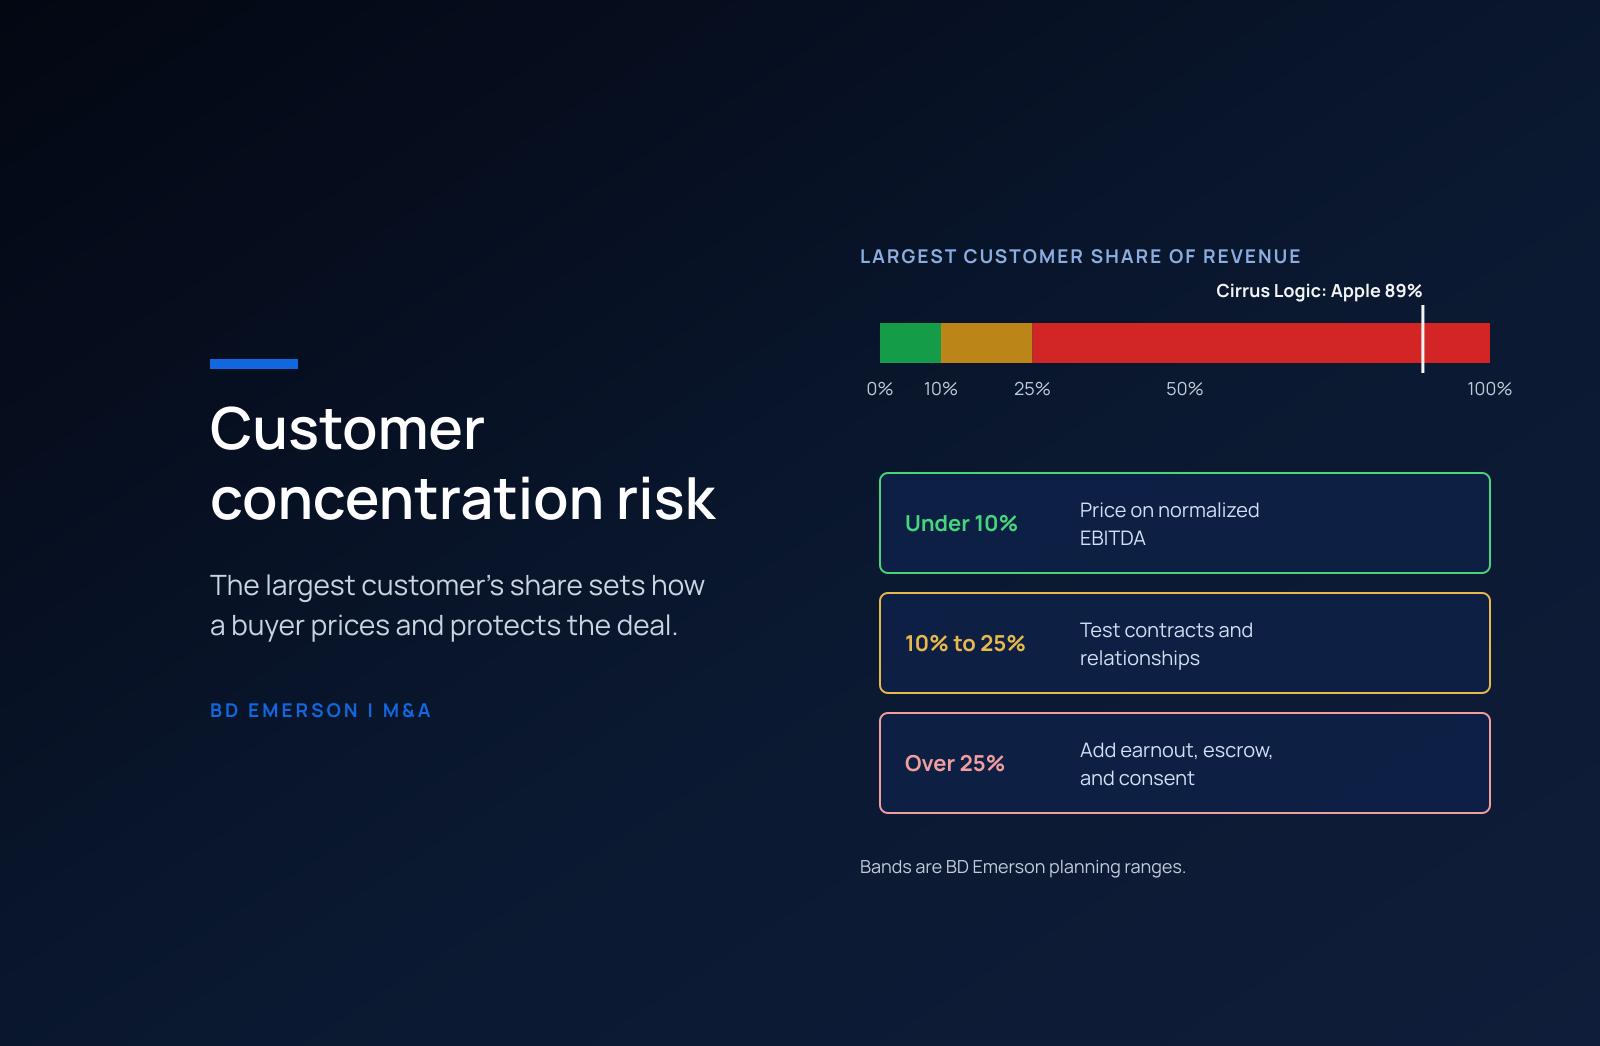
Customer concentration risk is the exposure a business carries when a few customers produce a large share of its revenue, so that losing one of them would cut earnings sharply. In an acquisition, buyers measure it as the share of revenue and gross profit from the largest customer and the top ten, test whether those relationships will survive a change of ownership, and then respond with price, deal structure, or both. Heavy concentration can sit inside a durable business: Cirrus Logic reported that a single end customer, Apple, accounted for about 89 percent of its fiscal 2025 net sales. What buyers penalize is concentration they cannot see, cannot verify, or cannot protect against in the purchase agreement.
How do buyers measure customer concentration?
The first measure is the simplest: the share of trailing twelve-month revenue that comes from the largest customer, the top five, and the top ten. Buyers then look at the trend over three years, because a top customer whose share has grown from 15 percent to 30 percent tells a different story than one that has held at 30 percent for a decade. Cirrus Logic's filing shows both views at once. Apple's share rose from about 83 percent in fiscal 2023 to 87 percent in fiscal 2024 and 89 percent in fiscal 2025, and the company's ten largest end customers represented about 96 percent of net sales in the latest year, according to its annual report on Form 10-K.
A single summary number helps when the customer base is long. The Herfindahl-Hirschman Index, the same measure antitrust agencies use for market concentration, works on customer shares too: square each customer's percentage share of revenue and add the results. A business with one customer at 40 percent and sixty customers at 1 percent each scores 1,660 on a scale that runs to 10,000, and tracking that score quarter by quarter shows whether concentration is rising or falling faster than the top-ten table suggests.
Revenue share is only half the picture. The largest customers often negotiate the lowest prices and the longest payment terms, so a customer at 30 percent of revenue can be 20 percent of gross profit and 40 percent of receivables. A buyer that measures concentration on revenue alone misreads both the earnings at risk and the working capital tied up in one account.
Financing exposes the same issue from another angle. Asset-based lenders commonly limit how much of the receivables owed by any single account debtor counts toward the borrowing base, so a concentrated customer base can shrink the revolver a buyer planned to draw at closing. Cash flow lenders look at the same customer list when they size the debt and set covenants. The concentration analysis belongs in the financing workstream as early as it belongs in valuation, because a lender that finds the issue late can change the capital structure the bid assumed.
Where does concentration hide?
Invoice data can understate concentration. Cirrus Logic's 10-K notes that Apple purchased "through multiple contract manufacturers," which means a ledger sorted by bill-to customer shows several accounts where the economic dependency runs to one. The same pattern appears when a target sells to several subsidiaries of one parent, to portfolio companies owned by one private equity sponsor, to franchisees that follow one franchisor's vendor list, or to agencies that draw on one government budget. Diligence maps revenue to the party that makes the buying decision, and it builds the customer list from that map.
Public companies disclose some of this. Regulation S-K Item 101 asks registrants to describe "any dependence on revenue-generating activities, key products, services, product families or customers, including governmental customers," and it lists "Dependence on one or a few major customers" among the topics a smaller reporting company addresses, as the text of 17 CFR 229.101 shows. Public companies also disclose any single customer that reaches 10 percent of revenue under the segment reporting standard, ASC 280. Most private targets publish nothing comparable, so the buyer builds the analysis from the general ledger and the billing system.
What does a customer concentration analysis include?
The core exhibit is a customer cube: revenue by customer by month for at least 36 months, pulled from the billing system and reconciled to the general ledger. From the cube, the diligence team calculates retention and net revenue retention for the top accounts, separates volume changes from price changes, and flags customers whose purchases have stepped down. The quality of earnings work then carries the findings into EBITDA. If a top customer has given notice, cut volume, or moved to a competitor for part of its spend, the quality of earnings report adjusts run-rate EBITDA for the loss, and the buyer prices on the adjusted number.
The contract review comes next. For each customer above the concentration threshold, the team records the term and renewal date, termination-for-convenience rights and notice periods, exclusivity, most-favored-customer pricing, volume commitments, rebates, and any change-of-control or anti-assignment clause that lets the customer exit or reprice when ownership changes. An asset purchase usually requires assignment of the contract, which can turn a passive anti-assignment clause into a consent the seller must obtain before closing.
The relationship review closes the loop. Commercial diligence interviews the top customers, with the seller's consent and usually late in the process, to learn why they buy, what would make them switch, and whether they plan to consolidate vendors or bring the work in-house. When the buyer competes with the target, customer-level pricing and margin data should move through a clean team so competitively sensitive information stays with people who do not set prices.
How does concentration change the price and the deal structure?
Buyers respond to concentration in proportion to how much of the earnings sits with one relationship and how well the contracts protect it. The table below sets out the planning ranges BD Emerson uses to scope the work. The thresholds are working ranges for diligence planning, and the right response in any deal depends on contract terms, customer health, and how replaceable the revenue is.
| Largest customer share of revenue (BD Emerson planning range) | What diligence must establish | Responses buyers commonly use |
|---|---|---|
| Below 10 percent | Standard customer cube, retention by cohort, and pricing trends | Price on normalized EBITDA with no customer-specific protection |
| 10 to 25 percent | Contract terms, renewal timing, relationship depth, and a customer interview | Valuation discount, a material customer representation, and run-rate adjustments for known losses |
| Above 25 percent | Whether the relationship survives new ownership, plus written consent where a change-of-control clause applies | Earnout or deferred consideration tied to retention, escrow or holdback, and in some deals a closing condition on renewal or consent |
Contingent consideration is the most direct tool. An earnout tied to revenue from the top customer, or to total revenue over one or two years, shifts part of the retention risk back to the seller who knows the relationship best. Escrows and holdbacks do similar work on a smaller scale.
The purchase agreement carries the rest, and deal counsel drafts it. Diligence supplies the customer list and the evidence that the representations rest on. The merger agreement Star Equity Holdings signed to acquire Harte Hanks on August 14, 2026 shows a current form. It defines a Material Customer as any customer that made aggregate payments above $1,000,000 in fiscal 2025 or year-to-date fiscal 2026, and in Section 3.13(c) the company represents that no Material Customer intends to terminate, not renew, materially reduce purchases under, or renegotiate its relationship, according to the agreement filed with the SEC. A representation like that is only as good as the work behind the disclosure schedule that lists the exceptions.
What can a seller do before going to market?
Diversification takes years, so a seller with a two-year runway should spend it on the terms of the relationships it already has. Renewing the largest contracts for multi-year terms before a sale, removing termination-for-convenience rights where the customer will agree, and negotiating out change-of-control triggers at renewal all reduce the discount a buyer applies. Broadening the relationship helps as well: a customer served through one founder's personal contact looks riskier than one with several working relationships across operations, finance, and procurement.
The seller should also build the customer cube before a buyer asks for it. A sell-side quality of earnings report that presents concentration accurately, mapped to end customers and supported by contract summaries, lets the seller frame the risk instead of watching a buyer discover it late and re-trade the price. The worst outcome for a seller is a concentration finding that surfaces after the letter of intent, when exclusivity has already shifted bargaining power to the buyer.
BD Emerson builds customer cubes, contract reviews, and customer interview programs for buyers, sellers, and private equity sponsors, and we tie the findings to the earnings and the deal terms. To scope a customer concentration review for a deal in process, see our commercial due diligence services.

About the author