Palantir Foundry Dashboards: Contour, Quiver, Workshop, and Which Tool to Use
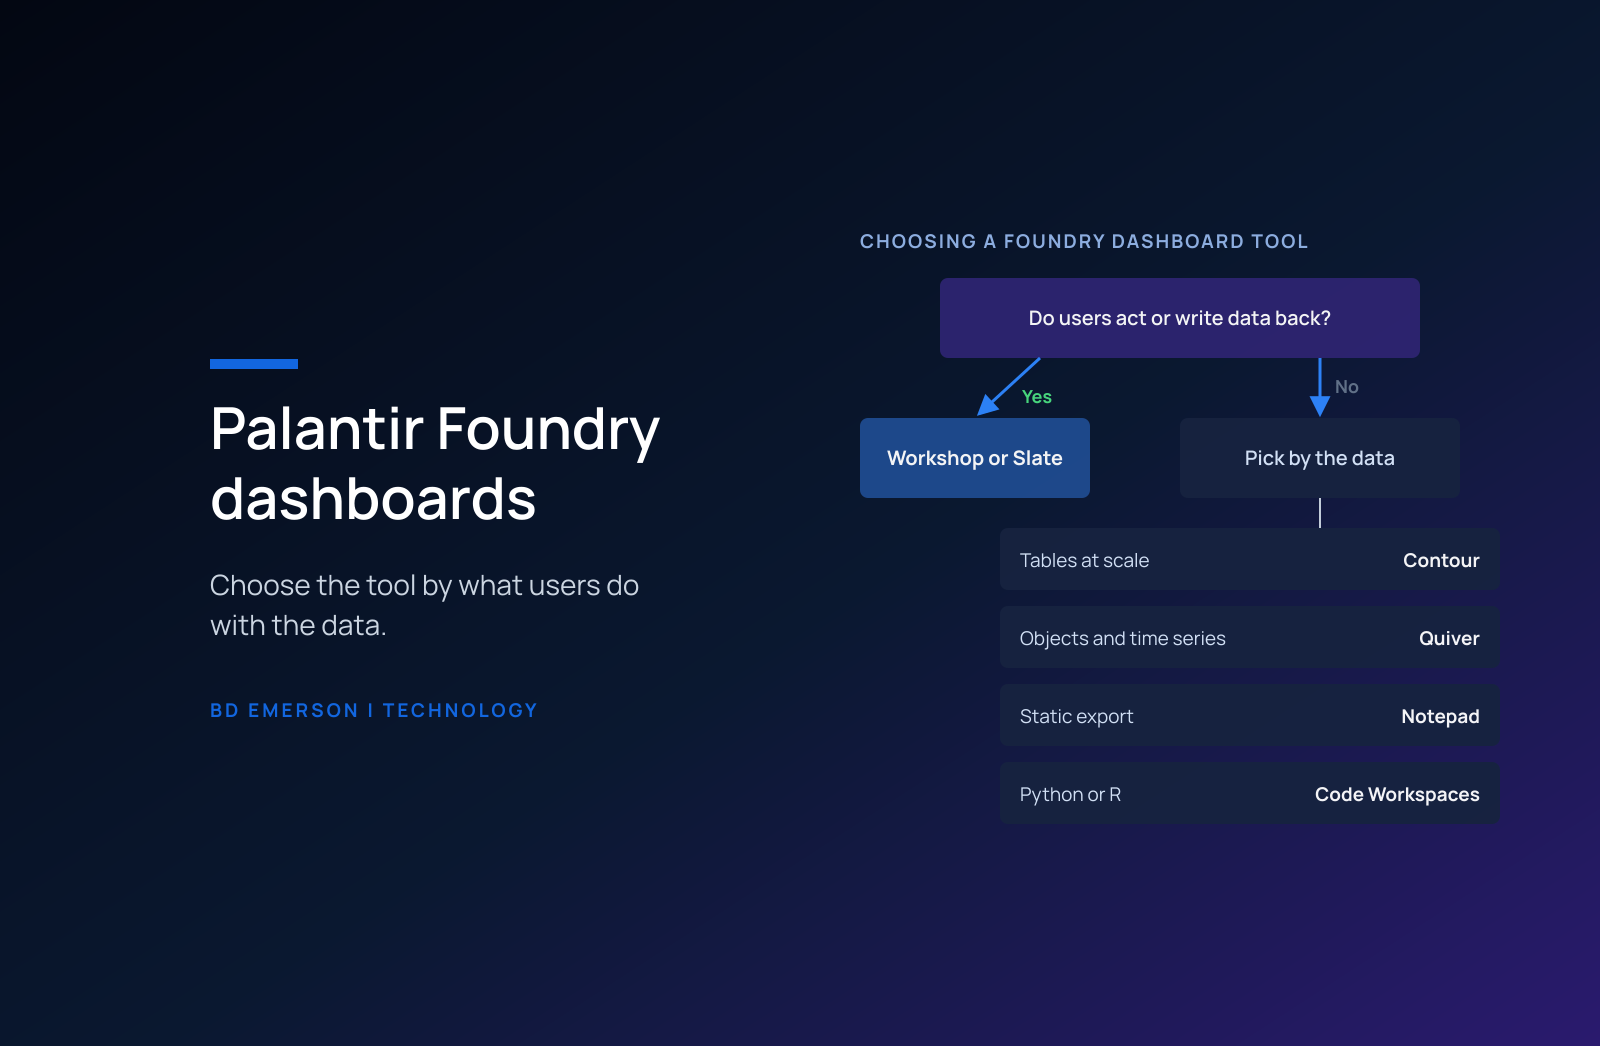
A Palantir Foundry dashboard is the output of one of several Foundry applications, and the right one depends on the shape of the data and on what users need to do with it. Contour builds dashboards from analysis on tables at scale. Quiver builds read-only, interactive dashboards from ontology object and time series data, and those dashboards can sit inside Workshop. Notepad produces static reports for export, and Code Workspaces hosts Python and R applications built with Dash, Streamlit, or Shiny. When users need to act, write data back, or work through several steps, Palantir points to its application builders: Workshop for operational applications on ontology objects, and Slate for low-code applications with custom HTML, CSS, and JavaScript.
What counts as a dashboard in Foundry?
Palantir's dashboards documentation treats a dashboard as a way to present analysis, and it names five places to build one: Contour, Quiver, Code Workspaces, Notepad, and custom applications such as Workshop. The documentation draws a clear line between them. Contour dashboards and Quiver templates are "best suited for direct consumption within Foundry," Notepad suits static, exportable reporting, and the application building tools fit use cases that need "full customization and layout flexibility," multi-step workflows, or writeback.
That line matters more after the build than during it. The team that builds a dashboard picks a tool, and the platform team inherits the choice along with its running cost. A dashboard built in the wrong tool costs more to run, breaks when the data model changes, or sends users to another system to act on what they see. If you are new to the platform, our overview of what Palantir Foundry is explains how these applications sit on top of the data layer.
Which Foundry tool should build your dashboard?
The table maps each tool to the data it works on, the situation it fits, and what your platform team should watch once it is in production.
| Tool | Works on | Use it when | What to watch after go-live |
|---|---|---|---|
| Contour | Tables at scale | Analysts explore and filter large datasets inside Foundry | Every board update uses compute, and a parameter change bypasses the cache |
| Quiver | Ontology object and time series data | Operational users need analysis inside Workshop or an Object View | Dashboards are read-only, so users act somewhere else |
| Notepad | Content embedded from other applications | You need a static report people can export | Users cannot run analysis or create charts in Notepad |
| Code Workspaces | Python with Dash or Streamlit, R with Shiny | A data science team wants an application written as code | Someone on the platform team has to maintain the code |
| Workshop | Ontology objects, links, and actions | Users act on what they see, including writing data back | Every change to the object types it reads needs testing |
| Slate | Low-code builder with HTML, CSS, and JavaScript | You need a custom layout, dashboard, or landing page | Custom code to own after the builders leave |
When is Contour the right tool?
Contour is Palantir's point-and-click tool for analysis on tables at scale, and its dashboards present the results of a Contour analysis with chart-to-chart filtering, parameters, a full-screen presentation view, and PDF export. Use it when analysts need to explore and filter large datasets and the audience reads the result inside Foundry. Its compute profile is the thing to understand before the build team leaves. Palantir's Contour compute documentation says compute is used "each time a Contour board is created or updated," including cascading compute on boards downstream in the same path, and that changing input data or a parameter prevents Contour from using its cache.
Contour also caches identical queries on identical data, so two users who open the same analysis in sequence trigger one computation, and checkpoints let it serve results further down a long path. The practical rules follow from that design. Place filters before expensive operations, keep paths short, and move a heavy analysis that many people read into a scheduled dataset, which Contour measures as a batch job without the always-on overhead of interactive use.
When is Quiver the right tool?
Quiver "provides a point-and-click interface to perform data analysis on object and time series data from the Ontology." Its dashboards are read-only and interactive, and they can stand alone or sit inside Object Views, Workshop, or Notepad. That embedding is Quiver's main strength for an operational team: an engineer builds a time series chart once and places it inside the Workshop application where a planner or a maintenance lead makes the decision. Because Quiver reads from the Palantir ontology, its dashboards change when the object types they read change, which ties dashboard maintenance to the ontology's release process.
Contour or Quiver: how do you choose?
The deciding question is whether the data already lives in the ontology. Contour works on tables, so it fits data that exists only as datasets, such as a finance extract that nobody has modeled as objects, or an exploratory analysis across raw tables before anyone decides what the objects should be. Quiver works on ontology objects and time series, so its dashboards describe the same aircraft, orders, or patients that your operational applications act on, with the same properties and the same permissions. When an operational team will make decisions from the dashboard, build it in Quiver on the ontology so the dashboard and the application never disagree about what an object is. When analysts are still exploring, Contour lets them work without waiting for the data model.
When do you need Workshop or Slate instead?
Palantir's application building overview calls Workshop "the fastest way to turn objects, links, and actions into an interactive workflow." Workshop reads its data from the ontology and uses actions to write data back to objects, so a user can see a late shipment, reassign it, and record the reason on one screen. That is the boundary between a dashboard and an operational application. Once users need to act on what they see, a read-only dashboard sends them to another system, and Workshop keeps both the decision and the record in Foundry.
The same overview describes Slate as "a low-code, drag-and-drop builder for operational applications, interactive dashboards, and custom landing pages," with optional customization in HTML, CSS, and JavaScript. Slate fits when layout control matters more than speed of construction. For experiences beyond what the built-in tools offer, Palantir points to custom React applications built on the Ontology SDK. Each step from Workshop to Slate to a custom application adds code your platform team must maintain after the builders leave, so make that step only when a requirement forces it.
Where do Notepad and Code Workspaces fit?
Palantir's dashboards documentation says Notepad "is designed for reporting workflows that focus on creating static content that may be exported." A Notepad document can pull content from several applications, such as a Quiver chart and a Contour table, but users cannot run analysis or create charts inside it. Use it for the weekly operating review that goes to people who never log in to Foundry. Code Workspaces supports Dash and Streamlit for Python and Shiny for R, with version control, branching, and data governance built in, which suits a data science team that wants its application written and reviewed as code.
What does a Foundry dashboard cost to run?
Every dashboard runs queries, and queries consume compute. Palantir's usage types documentation measures computational work in Foundry compute-seconds and notes that the ontology's indexed stores use compute-seconds when executing their queries. A Workshop module or Quiver dashboard that hundreds of users open each morning is a recurring query load, and a Contour analysis whose parameters users change all day skips the cache on every change.
Three habits keep the cost predictable after go-live. Inventory dashboards every quarter and retire the ones nobody opens, along with any datasets and schedules that exist only to feed them. Move heavy, widely read analyses to scheduled datasets. Give each dashboard an owner who can see its usage in Resource Management, so a cost question reaches the person who can change the design.
Who maintains Foundry dashboards after the build team leaves?
Dashboards break in predictable ways: an upstream column is renamed, an object type gains or loses a property, or a parameter default stops matching how people work. Each failure needs an owner and a release path. Foundry's Global Branching supports Workshop modules, the ontology, Pipeline Builder, functions, and code repositories, so a change to an object type and the Workshop module that reads it can be tested together on one branch before either reaches users. Write that rule into the handoff from Palantir's forward deployed engineers, and give every production dashboard a named owner on the platform team.
Keep a dashboard inventory as part of that handoff. For each production dashboard, record the tool, the owner, the audience, the datasets or object types it reads, the schedules that feed it, and the date someone last confirmed it is still used. The inventory turns a quarterly cleanup into a one-hour review, and it gives a new engineer a map of what breaks when a source system or an object type changes.
BD Emerson's engineers build Workshop applications, Quiver and Contour dashboards, and the pipelines behind them, and we take over their operation and extension when Palantir's forward deployed engineers roll off. Our Palantir Foundry implementation page covers how we deliver Workshop applications and hand them to your team, and our Palantir managed services page covers how we run them after go-live.

About the author