Market Sizing: Methods, Math, and What Diligence Checks
Market sizing is the work of estimating the revenue available in a defined market, and a market size analysis is the document that shows how you got the number. The method is settled: define the market boundary precisely, build the size bottom-up from customer counts and pricing, cross-check it top-down against published data, and present the result as a range with the drivers named. What separates a useful analysis from a slide decoration is that every input has a source and every assumption is written down, because the number will eventually be tested by someone with money at stake: an investor in a raise, a buyer in diligence, or a board deciding a market entry. This article covers the methods, the data sources, and the specific tests a diligence team applies.
Start with the market definition, because that is where sizing goes wrong
Most bad market sizes fail before any arithmetic happens, at the definition step. A market boundary has four dimensions: the customer (who has the problem), the product scope (what spend you actually address), the geography, and the time frame. Each one changes the number by multiples. "The US cybersecurity market" is a definition that supports almost any number between $20 billion and $200 billion depending on what gets included, which is exactly why it appears in weak decks. "Annual spend by US companies with 100 to 5,000 employees on external penetration testing" is a boundary a reader can verify, and the discipline of writing it forces the honest version of the number. Define the market you sell into, and let the layered model handle the aspiration: the framework for that is covered in our guide to TAM, SAM, and SOM.
Bottom-up: the method that carries the analysis
A bottom-up market size multiplies the count of potential customers by the annual revenue each represents. Both inputs deserve real work. For counts, the US Census Bureau's County Business Patterns and Statistics of US Businesses give firm counts by industry code and employee band at no cost, industry associations publish member universes, and commercial data providers can produce counts filtered by technology stack or regulatory exposure. For revenue per customer, use actual pricing evidence: your own average contract values by segment, competitor list pricing, and procurement data where you can get it. Segment before you multiply, because a single blended price across enterprise and mid-market produces a number that matches neither. The output is a table any reader can recompute: segments, counts, price per segment, and the total. That reproducibility is the point. A market size that cannot be rebuilt from its own exhibits is an assertion, and assertions get discounted.
Top-down: the cross-check, and the trap
Top-down sizing starts from published industry figures and narrows them to your boundary. Used alone it is the weakest method, because analyst definitions are broad, methodologies are opaque, and the same headline number appears in every competitor's deck. Used as a cross-check it earns its place: when your bottom-up build says $900 million and a defensible narrowing of the analyst figure says $1.1 billion, the convergence is evidence that both are roughly right. When the two disagree by five times, one of your inputs is wrong, and finding which one is the most valuable hour in the whole analysis. Our guide to calculating total addressable market works through both methods with the math shown.
Present a range, name the drivers, date the sources
A market size analysis should end in a range, not a point estimate, because a point estimate claims precision the inputs do not have. The honest form is a base case with the two or three assumptions that move it most: "roughly $800 million to $1.2 billion, driven by how many of the 40,000 firms in the two largest segments buy externally rather than build in-house." Growth belongs in the analysis too, with its own sourcing, because a smaller market growing 25 percent a year is a different investment case from a large flat one. Date every source in the document itself. Analysts revise, census data updates on a cycle, and a reader who finds one stale citation stops trusting the rest.
Sizing growth, not just size
A market size analysis that stops at today's number answers half the question, because capital is priced on where the market is going. Source the growth rate with the same discipline as the base: historical category growth from revealed data where it exists, adoption-curve logic where it does not, and a stated view on the driver, regulation, technology replacement cycles, or demographic shift, that makes the rate defensible. Separate market growth from share growth in every projection, because a plan that quietly needs both to be exceptional is two bets presented as one. And note the asymmetry in how readers price the two errors: an understated market costs you nothing in a diligence conversation, while an overstated one costs credibility across the whole document.
A worked example, end to end
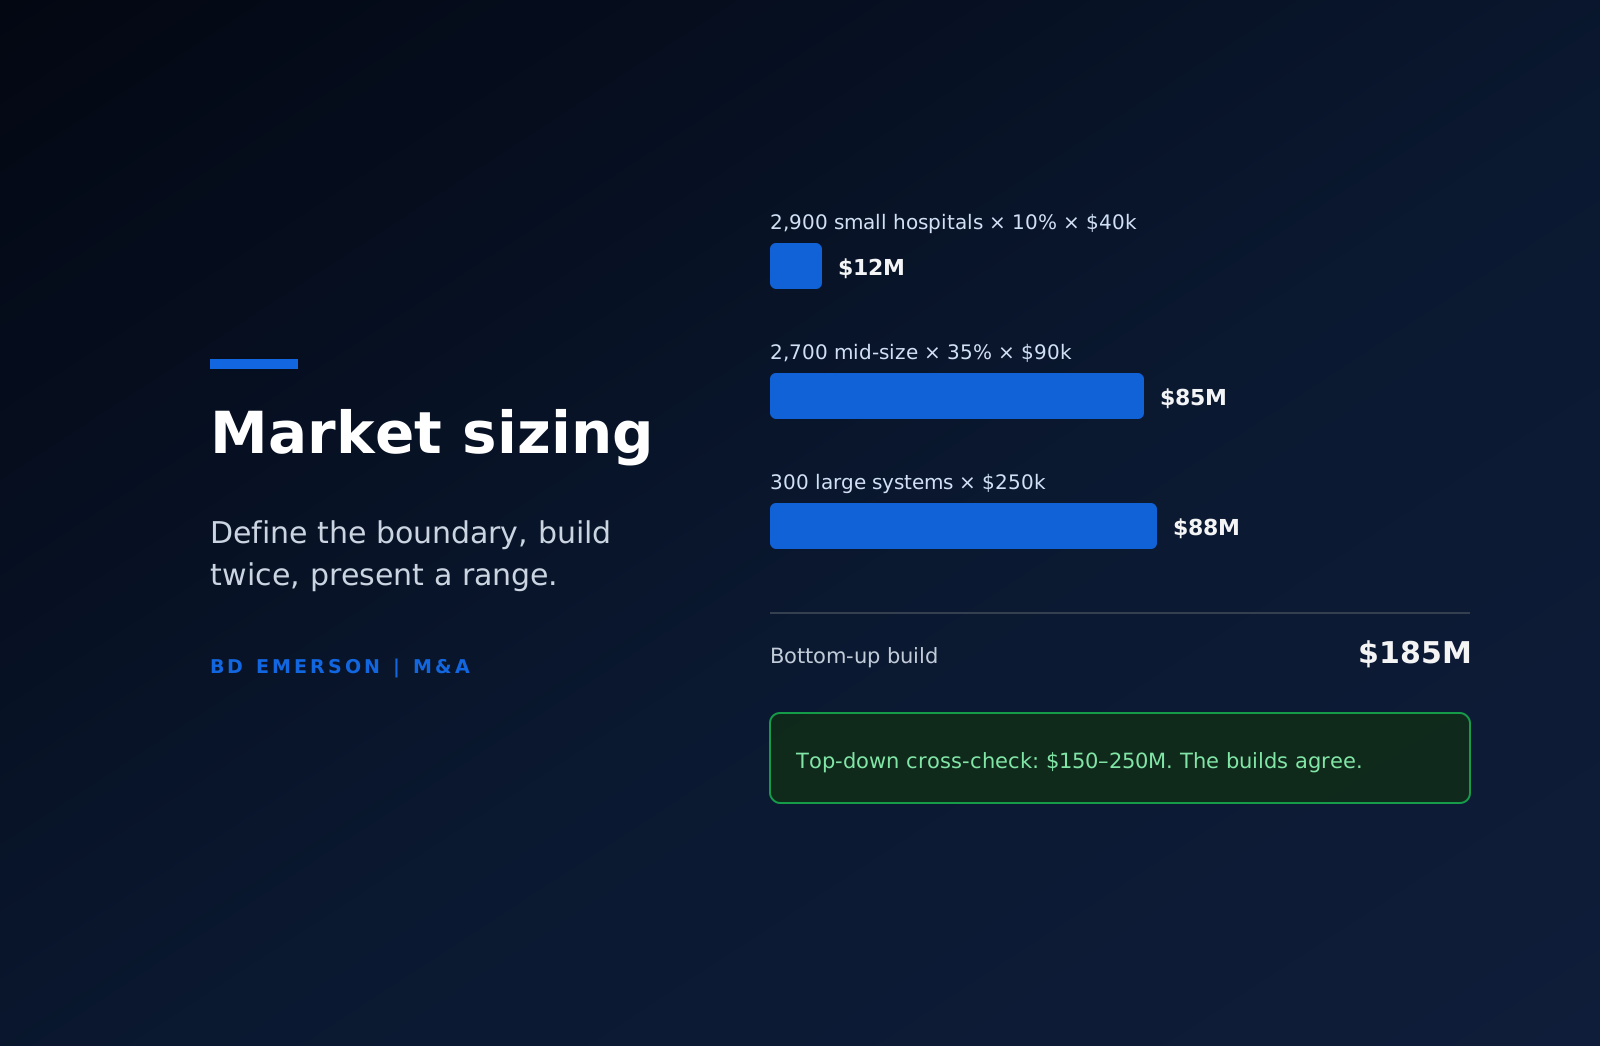
A firm selling incident response retainers to US hospitals wants the market sized. Definition: annual spend by US hospitals on external incident response retainers and related readiness services. Bottom-up: roughly 6,100 US hospitals, segmented by size. The 2,900 with fewer than 100 beds rarely buy standalone retainers, so they enter at a 10 percent adoption assumption and a $40,000 average contract. The 2,700 mid-size hospitals carry a 35 percent adoption assumption at $90,000. The 500 large systems buy at the system level, roughly 300 buying entities at $250,000. The build produces about $185 million today. Top-down cross-check: healthcare security services spend narrowed to the incident response line lands between $150 and $250 million. The two agree, so the analysis ships as $150 to $220 million today, with growth driven by insurer and regulator pressure on response readiness, and every input sits in a table a diligence reader can recompute. That is the whole method: a boundary, two builds, a range, and named drivers.
Data sources, matched to budget
Good sizing does not require expensive data, and expensive data does not rescue a bad boundary. At zero cost: Census Bureau business counts by NAICS code and employee band, Bureau of Labor Statistics industry data, SEC filings of public companies in the category, whose reported revenue and customer counts anchor price and share math, and trade association statistics. At moderate cost: a commercial firmographic database to count companies by technology stack, headcount, or industry more precisely than NAICS codes allow, and one or two analyst reports used for the cross-check rather than the headline. At diligence budgets: primary research, meaning structured interviews with buyers in the segment about what they spend, with whom, and what would change it. The pattern worth internalizing is that the count side of the math is usually solvable with free public data, and the price side is usually solvable with your own contract evidence, so the spend, when there is any, belongs on primary research that tests behavior rather than on another report restating the category.
How diligence tests a market size
When a company is sold or raises institutional capital, the market model faces commercial due diligence, and the tests are predictable. The diligence team rebuilds the bottom-up math from primary sources and compares. They interview customers and prospects to test whether the buying behavior the model assumes actually exists. They compare the market definition against the revenue the company books today, because a company claiming a $2 billion market while selling into three customer segments that sum to $300 million has a definition problem. They test the growth assumption against historical category growth rather than forecast enthusiasm. And they check internal consistency: the market size, the revenue plan, and the sales capacity model all have to describe the same company. A model built the way this article describes passes those tests by construction, which is worth more than any single number in it, because in a transaction a market claim that survives diligence protects the price and one that fails becomes a negotiation against you.
Where to get help
BD Emerson builds and tests market models inside commercial due diligence engagements, for acquirers who need a target's market verified before they pay for it and for sellers and management teams who want the model diligence-ready before the process starts. If the market size is about to carry weight in a transaction, test it before the other side does.

About the author