TAM, SAM, SOM: Market Sizing That Survives Investor Scrutiny
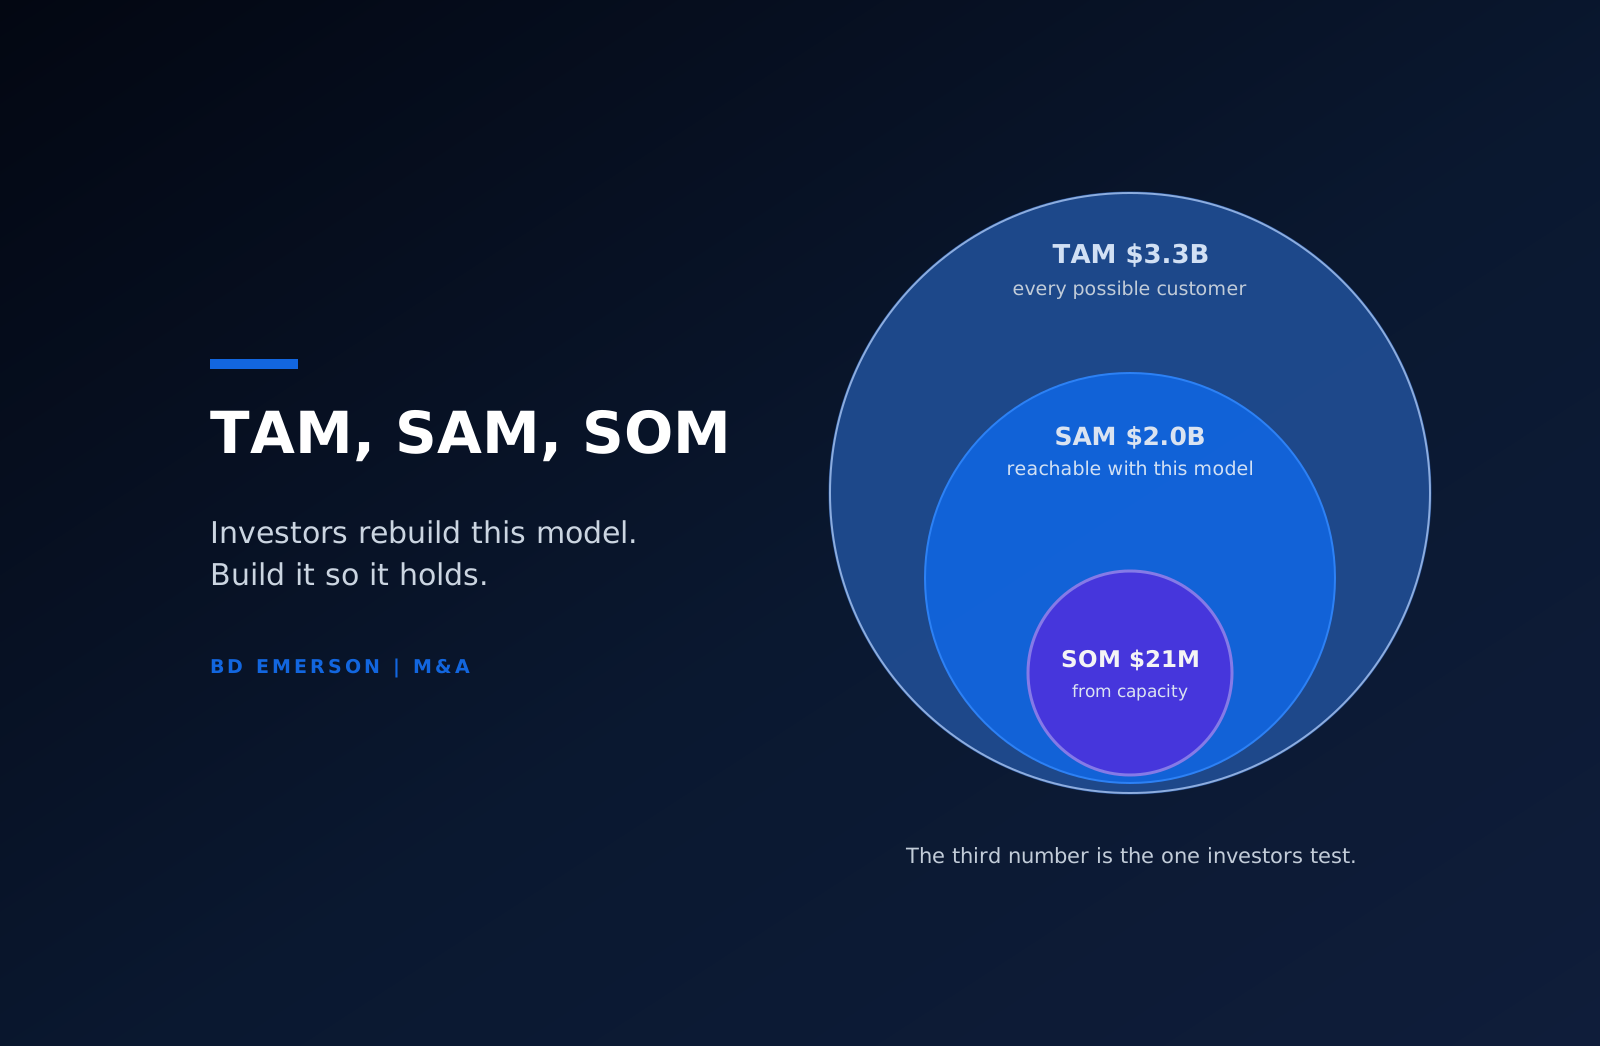
TAM, SAM, and SOM are the three numbers that describe how big a market is and how much of it a company can credibly take. TAM, the total addressable market, is the full revenue opportunity if every possible customer bought. SAM, the serviceable addressable market, is the slice of TAM your product and business model can actually reach. SOM, the serviceable obtainable market, is the share of SAM you can realistically win in a planning horizon, usually three to five years. Investors read the three numbers together as a test of judgment: TAM says the prize is worth chasing, SAM says you know your real market, and SOM says you can count. Most market slides fail on the third number, because founders present an aspiration where investors expect arithmetic.
What each layer actually means
TAM answers the question a board or an investment committee asks first: if this works completely, how big can it get? It is deliberately unconstrained by your current product, geography, and sales capacity. A company selling compliance software to US healthcare providers might define TAM as every organization worldwide that must comply with a security or privacy framework. The number is large by design, and it is the least believed of the three, which is fine. Its job is to establish a ceiling, and we cover the calculation methods in detail in our guide to total addressable market.
SAM applies your real constraints. Which geographies can you sell into today, which segments does the product actually serve, which regulatory or language barriers cut the market down? The healthcare compliance vendor might serve only US providers with 50 to 5,000 employees, because the product assumes US frameworks and the sales motion cannot support enterprise procurement. SAM is where a reader learns whether you understand your own business model, because every constraint you apply is a claim about how you operate.
SOM is the share of SAM you will win, and it has to reconcile with the rest of your plan. If SOM implies $40 million in revenue by year five, your hiring plan, pipeline math, and pricing have to produce $40 million when multiplied out. The fastest way to lose a diligence reader is a SOM that your own sales capacity cannot deliver. A defensible SOM is usually built from the bottom up: reps you can hire, deals per rep per year, average contract value, and a churn assumption, compounded over the horizon.
A worked example
Take a vendor selling vulnerability management software at an average contract value of $30,000 per year. There are roughly 33 million businesses in the US, but the product only makes sense for companies with dedicated IT, so the honest universe is companies with 100 or more employees, about 110,000 of them. TAM is 110,000 times $30,000, or $3.3 billion per year. SAM applies the model's constraints: the product integrates with two cloud platforms that about 60 percent of that universe runs, and the sales team sells only in North America, cutting the universe to roughly 66,000 companies and SAM to about $2 billion. SOM is built from capacity: a plan that grows to 25 account executives closing eight deals a year each, with 90 percent gross retention, produces roughly 700 active customers by year five, or about $21 million. That is one percent of SAM, which is the kind of SOM a diligence reader accepts without argument.
Notice what the example did. Every reduction from one layer to the next came with a stated reason and a number, and the final figure connects to an operating plan rather than to a percentage pulled from the air. "We will capture one percent of a $3 billion market" is the same arithmetic presented backwards, and it fails because the one percent has no machinery behind it.
How to calculate each number
There are three accepted methods, and the strongest market slides use two of them and show that the answers agree. Top-down starts from a published industry figure and narrows it with defensible filters. It is fast, and it is also the method most likely to produce a lazy number, because analyst market definitions rarely match your product's real boundary. Bottom-up multiplies the number of potential customers by what each would pay, built from census data, industry counts, or your own pipeline. It is slower and far more credible, because every input can be challenged and defended on its own. Value theory prices the problem rather than the product: estimate the cost your product removes or the revenue it creates, and price a share of that value. It is the right method for categories new enough that there is no incumbent spend to count.
For SAM, apply constraints one at a time and write each one down, because the list of constraints is itself diligence evidence that you understand the business. For SOM, build the capacity model described above and pressure-test it against your historical win rates rather than the win rates you hope for.
What investors actually check
A market slide gets maybe ninety seconds of attention, and the reader spends it on specific tests. They check whether SAM is derived from TAM with stated constraints or simply asserted as a smaller number. They check whether SOM reconciles with the revenue plan elsewhere in the deck, because the two are often built by different people and disagree. They check the source and date of every third-party figure, and a 2021 analyst estimate in a 2026 deck reads as neglect. They check whether the TAM definition quietly includes markets the product cannot serve, which is the single most common inflation. And in a funded diligence process, they rebuild the bottom-up math themselves, which is why the inputs matter more than the headline. The same tests appear in commercial due diligence on the sell side of an acquisition, where a market model that fails them becomes a price reduction. Our guide to market sizing covers the analysis in more depth.
Mistakes that sink the slide
The recurring failures are worth naming because they are all avoidable. Defining TAM as an entire industry's revenue rather than the spend your product addresses, so a payroll startup claims the payroll processing market plus the wages flowing through it. Skipping SAM entirely and presenting TAM and a percentage. Choosing a SOM percentage because it sounds modest rather than deriving it, since one percent of a made-up number is still a made-up number. Using a single top-down source with no bottom-up check. And presenting a static market when the honest story is a growing one, because a credible $800 million market growing 30 percent a year is a better investment case than an inflated $5 billion market growing at 3 percent.
Presenting the three numbers: the slide and the model behind it
The market slide should carry three figures, one line of method under each, and a source line with dates. The model behind the slide is a separate artifact, and it is the one that decides diligence outcomes: a spreadsheet where every count, price, and constraint is a labeled input a reader can change. Keep the two synchronized, because a deck figure that disagrees with the model it summarizes is the kind of inconsistency that turns a ninety-second review into a full rebuild. When you present, lead with SOM and work upward. Founders default to leading with TAM because it is the biggest number, but the audience that matters has seen thousands of large TAMs and funds companies based on the credibility of the path, so showing the obtainable number first, with the machinery visible, reads as confidence rather than modesty.
Ranges beat points at every layer. A SAM stated as $1.8 to $2.3 billion depending on how the mid-market constraint resolves invites a conversation about the constraint, which you are prepared for. A SAM stated as $2.1 billion invites a challenge to your precision, which nobody wins.
How the numbers age, and when to redo them
Market models decay. Pricing moves, segments consolidate, a competitor opens a category, and the census data underneath the counts gets revised. Redo the model on a calendar, annually at minimum, and before any event where it will be read by someone with money at stake: a raise, a sale process, a lender refinancing, a board vote on market entry. The update is cheap when the model was built as labeled inputs, which is another argument for the bottom-up build. Version the model and keep the old ones, because a company that can show how its market view evolved, and why, demonstrates exactly the judgment the three numbers exist to prove.
Where the numbers get tested
TAM, SAM, and SOM start as a fundraising exhibit, but the same model follows the company into every later transaction. Buyers in an acquisition rebuild it during commercial diligence, lenders test it before extending debt, and a board tests it before approving a market entry. Building the model once with sources and stated constraints means every later process starts from evidence rather than from a defense of old claims. If you are preparing for a capital raise or a sale and the market model needs to hold up to that scrutiny, BD Emerson's transaction advisory practice builds and pressure-tests market models as part of preparing companies for investor and buyer review.
About the author