Total Addressable Market: How to Calculate TAM
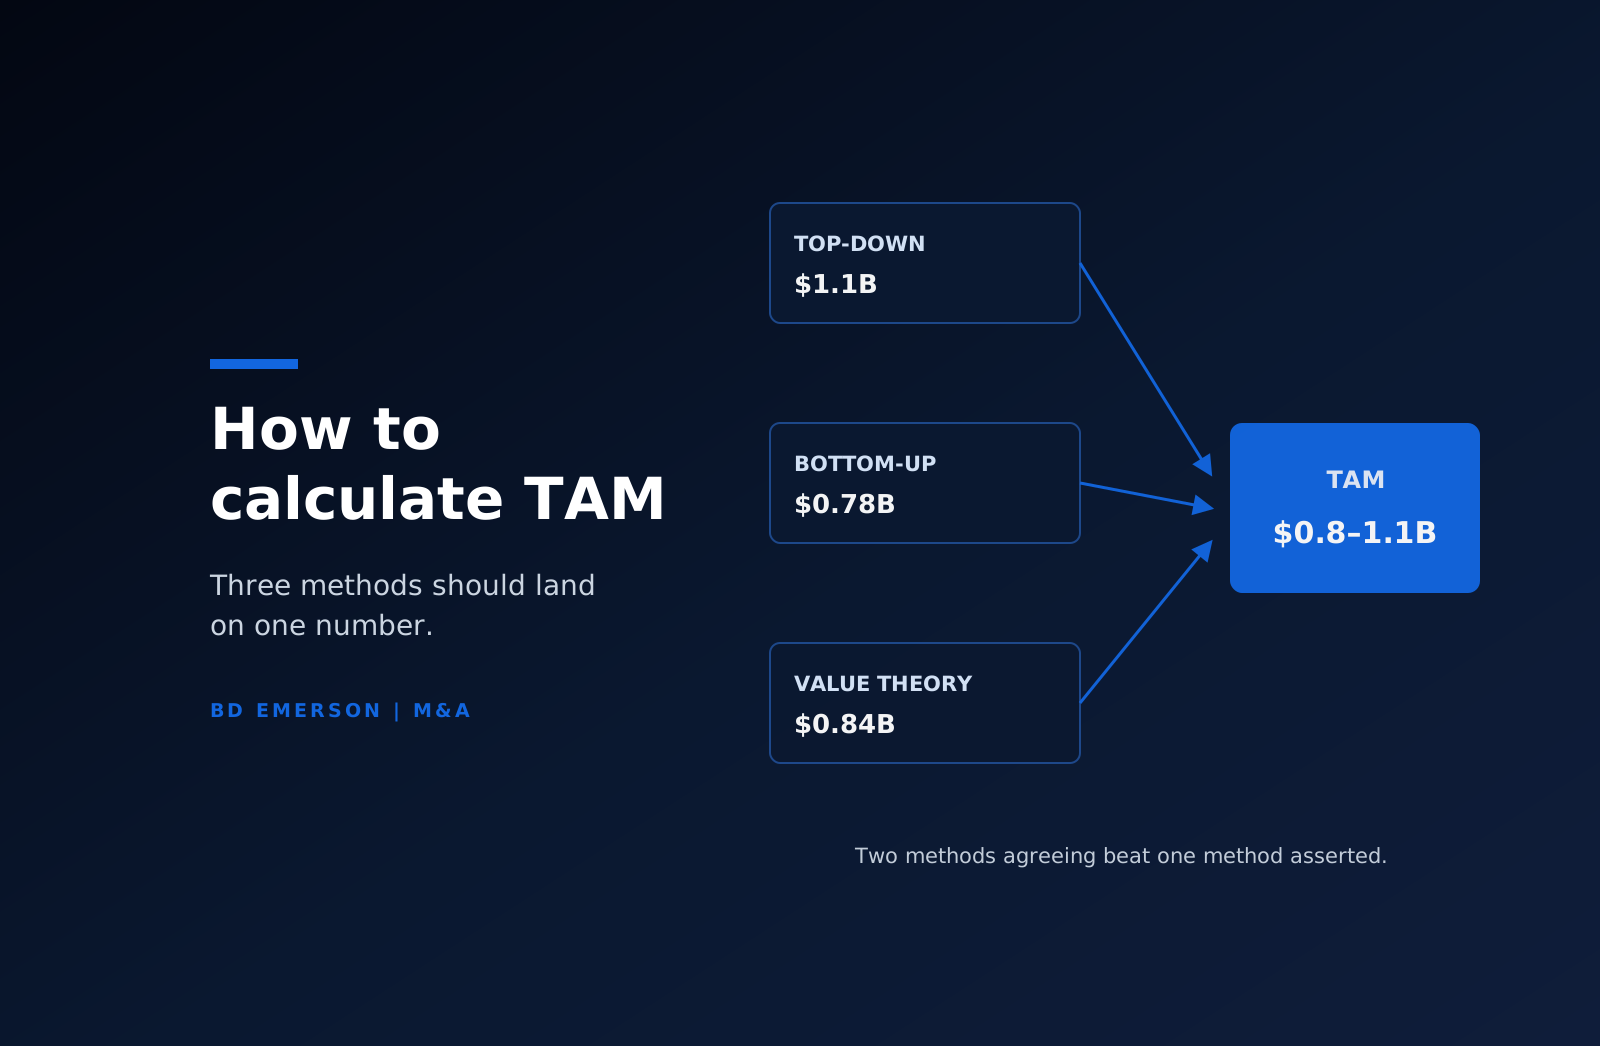
Total addressable market, or TAM, is the total annual revenue opportunity available if a product won every customer it could possibly serve. It is the ceiling on how big a business can get, and it is the first number investors, acquirers, and boards look for when they weigh whether an opportunity justifies the capital being asked for it. There are three ways to calculate TAM: top-down from published industry data, bottom-up from customer counts and pricing, and value theory from the economic value the product creates. The bottom-up method is the most trusted because every input can be examined, and the strongest work runs two methods and shows the answers converge. This article walks through the math of each and the checks a skeptical reader will run on your number.
What TAM is and is not
TAM measures the revenue available to your product category, at your pricing model, across every customer who has the problem you solve. It deliberately ignores your current geography, sales capacity, and product gaps, because those constraints belong to the serviceable layers below it. It is also bounded by what your product actually addresses, which is where most inflation happens. A company selling expense management software addresses the spend on managing expenses, and the fact that billions of dollars of expenses flow through the category does not make those dollars addressable revenue. TAM sits at the top of a three-layer model with SAM and SOM beneath it, and the layers only work when each one is derived from the one above with stated reasoning. We cover the full framework in our guide to TAM, SAM, and SOM.
Method one: top-down
Top-down starts with a market figure someone else has published, then narrows it. An analyst firm says global spend on identity and access management is $20 billion. Your product serves the workforce identity segment, which the same report sizes at 60 percent of the total, and you sell a cloud product in a market where cloud is 70 percent of new spend. TAM is $20 billion times 0.6 times 0.7, or $8.4 billion. The method takes an afternoon, and that is both its appeal and its weakness. The analyst's market definition rarely matches your product boundary, the underlying methodology is invisible, and every competitor pitching the same space is quoting the same number. Use top-down as a starting frame and a cross-check, and never as the only method in a document that will face diligence.
Method two: bottom-up
Bottom-up counts customers and multiplies by price, and it is the method that survives scrutiny. The formula is simple: the number of potential customer accounts, times the annual revenue per account. The work is in building both inputs so each can be defended on its own. Count customers from census data, industry association counts, or a data provider, segmented the way you actually sell. Price from your real list and your real average contract values by segment, because a TAM priced at your aspirational enterprise price when 80 percent of the universe is mid-market will not reconcile with your own pipeline. A worked example: 9,200 US community banks and credit unions, times an average platform contract of $85,000 per year, gives a TAM of about $780 million. Small next to a top-down claim, and far more useful, because a reader can challenge either input and you can defend both. When an acquirer's commercial diligence team rebuilds your market model, this is the math they build, so building it first yourself means the diligence confirms your number instead of replacing it.
Method three: value theory
Value theory prices the problem instead of counting existing spend, and it is the right method when the category is new enough that there is nothing to count. Estimate the economic value your product creates per customer, then take the share of that value a vendor can capture in price. If your product removes an average of $400,000 per year in manual reconciliation cost for a mid-market insurer, and software vendors in comparable categories capture 10 to 20 percent of the value they create, the addressable revenue per customer is $40,000 to $80,000, multiplied across the universe of insurers with the problem. The method requires you to defend the value estimate itself, usually with data from early deployments, which is why it works best once you have a handful of reference customers whose results you can cite.
TAM for a new product line inside an existing company
The same math serves corporate operators sizing an adjacency, with one change in inputs. An existing company has data a startup lacks: attach rates from its current base, real win rates by segment, and pricing evidence from live deals. Use them. A TAM for the new product line built from the existing customer base outward, current customers who fit, times observed attach rate, times price, then extended to the lookalike universe, is more defensible than any analyst figure, and it produces the adoption assumptions the launch plan needs anyway. The discipline that changes is the boundary: score the adjacency against what the company can actually deliver today, because internal TAM work inflates for political reasons just as pitch decks inflate for fundraising ones.
The inflation patterns diligence catches
Diligence teams see the same TAM inflations often enough to check for them by name. Flow-through inflation counts the money moving through a category as addressable revenue, so a payments product claims payment volume rather than the take rate on it. Category borrowing defines the market as an adjacent, larger category the product touches but does not serve, the analytics tool claiming the business intelligence market. Seat inflation prices every employee of every prospect as a user when the honest buyer is one team. Static-price inflation holds price constant across segments where real contracts show steep mid-market discounts. And future-market inflation counts spend that only exists if the category grows as forecast, presented as if it exists today. Each pattern is visible in five minutes to a reader who rebuilds the first row of the math, which is why the protection is doing that rebuild yourself before the document ships.
How to sanity-check the number
Whichever method produced your TAM, run three checks before anyone else does. First, reconcile against revealed spend: if your TAM is $5 billion but the largest incumbent in the category books $150 million, explain the gap or shrink the number, because markets rarely hide 97 percent of their spend. Second, check the implied penetration of your own plan, since a revenue plan that requires 15 percent of TAM by year five is a red flag in either direction, on the plan or on the TAM. Third, date and source every input, because diligence readers check citations before they check math, and a stale source discredits a correct number. A TAM presented as a range with named drivers, $2 to $3 billion depending on how much of the mid-market adopts, reads as more credible than a false-precision $2.7 billion.
How investors read the TAM slide
Knowing the reader's tests makes the work concrete. A venture investor reads TAM against fund math: the number has to support an outcome large enough to matter to their portfolio, which is why a precise $600 million TAM with a credible path can lose to a sloppier pitch in their scoring even when the business is better. A growth investor or acquirer reads TAM against penetration: they divide your revenue into your claimed market and ask why winning more of it gets easier rather than harder from here. A lender barely reads TAM at all and reads the customer concentration behind it. The same model serves all three when it is built from labeled inputs, because each reader can apply their own assumptions to your machinery. What none of them will do is trust a number whose machinery is hidden, and the most common feedback behind closed doors is some version of the market math being the weakest slide in an otherwise strong deck.
Where the number gets used
TAM shows up in fundraising decks, board market-entry decisions, and acquisition cases, and in each setting it is an input to someone's capital allocation. In a capital raise it frames whether the company can return the fund. In corporate development it frames what a buyer should pay for access to the market. In each case the number will be rebuilt by someone with an incentive to find it smaller, which is the practical argument for building it bottom-up with sources from the start. BD Emerson tests market models as part of commercial due diligence, on both sides of the table: for buyers who need a target's market claims verified, and for sellers who want the model to survive that verification with the price intact.

About the author