The Change Curve: What It Shows, Where It Came From, and Its Limits
The change curve is a model that traces how people's morale and performance tend to fall and then recover as they absorb a major change. It comes from Elisabeth Kübler-Ross's 1969 book On Death and Dying, which described how seriously ill patients responded to dying, and business adopted it in the years that followed. Research supports the temporary dip the curve shows and does not support the idea that people pass through fixed stages in a fixed order. Managers use the change curve to recognize what people are feeling and to time their support, and the model fails when a manager treats it as a schedule.
What is the change curve?
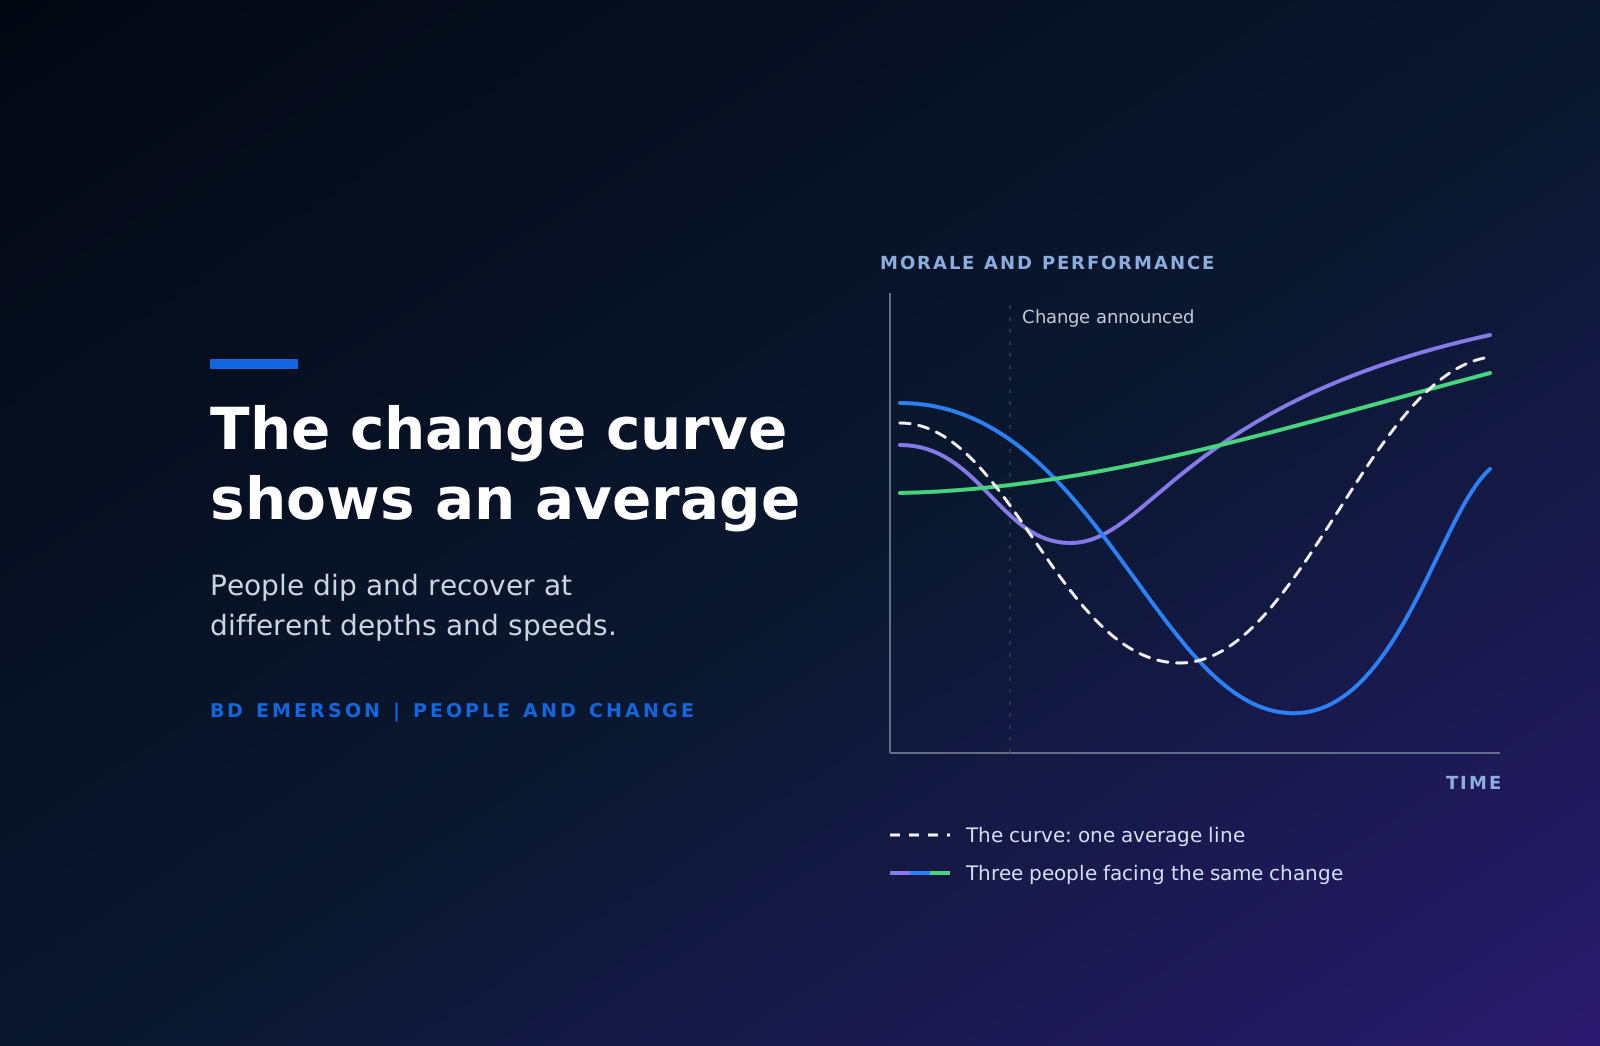
The change curve is a line drawn on two axes. Most business versions plot morale, energy, or performance on the vertical axis and time on the horizontal axis. The line starts level, drops after the change is announced, reaches a low point, and then climbs to a level at or above where it began. Labels along the line name the responses people commonly show at each point.
The Elisabeth Kübler-Ross Foundation's version, which it calls the Kübler-Ross Change Curve, shows seven areas of experience: shock, denial, frustration, depression, experiment, decision, and integration. Other versions use four or five labels. The versions share three claims. A significant change produces a period of lower morale and output before things improve. The low point is a normal part of the process. Recovery comes through trying the new way of working, deciding to commit to it, and making it routine.
Where did the Kübler-Ross change curve come from?
The curve traces to the work of Elisabeth Kübler-Ross, a Swiss psychiatrist. According to the Foundation that carries her name, the work began at the University of Chicago in the fall of 1965, when four students from Chicago Theological Seminary asked her to help them study dying. Over four years, she and her students interviewed hundreds of patients in long recorded conversations while students, chaplains, nurses, and doctors listened.
Her 1969 book, On Death and Dying, gave chapters to five responses she heard in those interviews: denial and isolation, anger, bargaining, depression, and acceptance. Two facts about the original source matter for anyone who uses the curve at work. The people she studied were patients facing their own death, so the model began as a description of dying and was extended to other losses and to organizational change afterward. She also wrote that the responses "will last for different periods of time and will replace each other or exist at times side by side," which is a looser claim than the staircase most slide decks show.
The move into business came through her audiences. The Foundation recounts that business people at her workshops told her the model matched what happens when a company reorganizes, and that she agreed. By the 1980s the model was being drawn as a curve in boardrooms, and in 1995 her family began licensing it under her name. The Kübler-Ross Change Curve is now a registered trademark of the Elisabeth Kübler-Ross Family Limited Partnership, and the Foundation states that using the curve or its diagrams in training materials, presentations, or publications requires a license.
What does the research say about the change curve's limits?
The research supports part of the model and contradicts the way it is usually taught. Three findings matter for managers.
The responses overlap
The strongest test of the stage idea comes from bereavement research. The Yale Bereavement Study, published in JAMA in 2007, followed 233 bereaved adults in Connecticut and measured disbelief, yearning, anger, depression, and acceptance over the two years after a loss. The five indicators peaked in the order the stage theory predicts. The same data showed that acceptance was the most frequently endorsed response from the first month onward, and that yearning, which is absent from the five stages in On Death and Dying, was the dominant negative response throughout. Acceptance and distress were present together from the start, so the picture of one stage ending before the next begins does not match the data.
The evidence comes from dying and grief
Kübler-Ross interviewed patients, and the JAMA study followed bereaved family members. Neither studied employees in a reorganization or a system rollout. The transfer to work rests on an analogy: a major change takes away something people valued, and people respond to that loss. The analogy holds for a plant closure or a layoff. It holds less well for a new CRM, where some employees gain from the change on the first day. A model built on loss will misread people who see the change as a gain, and it will misread people whose objection is a reasoned judgment about the design.
The dip is the best-supported part
The dip has support beyond the Kübler-Ross model. A review in the Journal of Organizational Change Management compared change models drawn from unrelated disciplines and found that a majority shared two characteristics: they follow Kurt Lewin's three-phase model of change, and they describe a degradation of capabilities in the intermediate stages of the change. The authors titled the paper after that middle period, calling it the "death valley" of change. Managers can rely on this part of the curve. People who are learning a new system or a new role perform worse for a while before they perform better.
How long does the dip last?
No research gives a reliable duration for the dip in a workplace change, and any chart that puts weeks on the horizontal axis is guessing. The length and depth depend on four things: how much of the job changes, how much skill people have to rebuild, how many other changes the same team is absorbing, and how much support arrives at the low point. The one measured timeline in this article comes from bereavement. In the JAMA study, the negative indicators all peaked within about six months of the loss. That figure describes grief after a death, and it does not transfer to a system rollout.
How do managers use the change curve?
Managers use the change curve as a shared vocabulary and as a planning prompt. The Foundation's own guidance to leaders carries the heading "Recognize, don't schedule," and explains that the curve helps name what people are feeling and sets no deadline for when they should be finished. The table shows how that guidance works in practice.
| Area of the curve | What a manager sees | What helps |
|---|---|---|
| Shock and denial | Silence, business as usual, and questions that assume the change will not happen | A plain statement of what is changing and why, repeated in person |
| Frustration and low mood | Complaints, errors, lower output, and absence | Listening, acknowledgment of what people are losing, realistic workloads, and a visible manager |
| Experiment | People try the new process, ask practical questions, and make mistakes | Training, practice time, floor support, and tolerance for early errors |
| Decision and integration | People choose the new way without prompting and help their peers | Recognition, retirement of the old process, and adoption measures |
Plan for the dip. Tell sponsors before launch that output will fall for a period after go-live, and budget for it with extra support staff, lighter targets, and time to practice. A sponsor who expects the dip will fund the support. A sponsor who does not expect it will read the dip as failure and start changing the plan.
Account for the leadership head start. Executives usually hear about a change long before employees do, so leaders have often reached commitment by the time their teams hear the news for the first time. Managers who remember this give their teams the time and information they had themselves.
Use it in conversation with individuals. The curve gives a manager a neutral way to ask how someone is doing with a change and to say that a hard patch is normal. The Foundation's guidance also tells leaders to expect overlap and return, and warns them against mistaking quiet for acceptance.
Measure adoption with data. The curve cannot tell a manager where a team stands. Pulse surveys, system usage, error rates, and training completion can, and a change management plan should name those measures before launch.
What mistakes do managers make with the change curve?
The common mistakes come from reading the curve as a prediction about each person.
- Treating the curve as a timetable. Telling a team it should be past anger by a certain week puts a deadline on a feeling and teaches people to hide what they think.
- Labeling people by stage. Saying that an employee is "in denial" turns a possibly valid objection into a symptom. Check whether the objection is right before assigning it to a stage.
- Assuming everyone starts with loss. Some employees welcome the change, some are indifferent, and some hold mixed views. Presenting a grief model to a team that is ready to move wastes its goodwill.
- Waiting for the curve to do the work. The model describes responses and prescribes nothing. Recovery depends on sponsorship, communication, training, and support, which someone has to plan and deliver.
- Copying the diagram without a license. The Kübler-Ross Change Curve is a registered trademark, so training teams should check the licensing terms before they reproduce it.
When is the change curve the wrong tool?
The change curve is a model of individual response. It has nothing to say about who sponsors the change, which roles are affected and how, what each audience needs to hear, or how adoption will be measured. A program that relies on the curve alone has a picture of feelings and no plan. Use the curve in manager training and one-to-one conversations, and use a structured change method for the program. Managers also need the skill to hold those conversations well, which is where leadership development supports a change program.
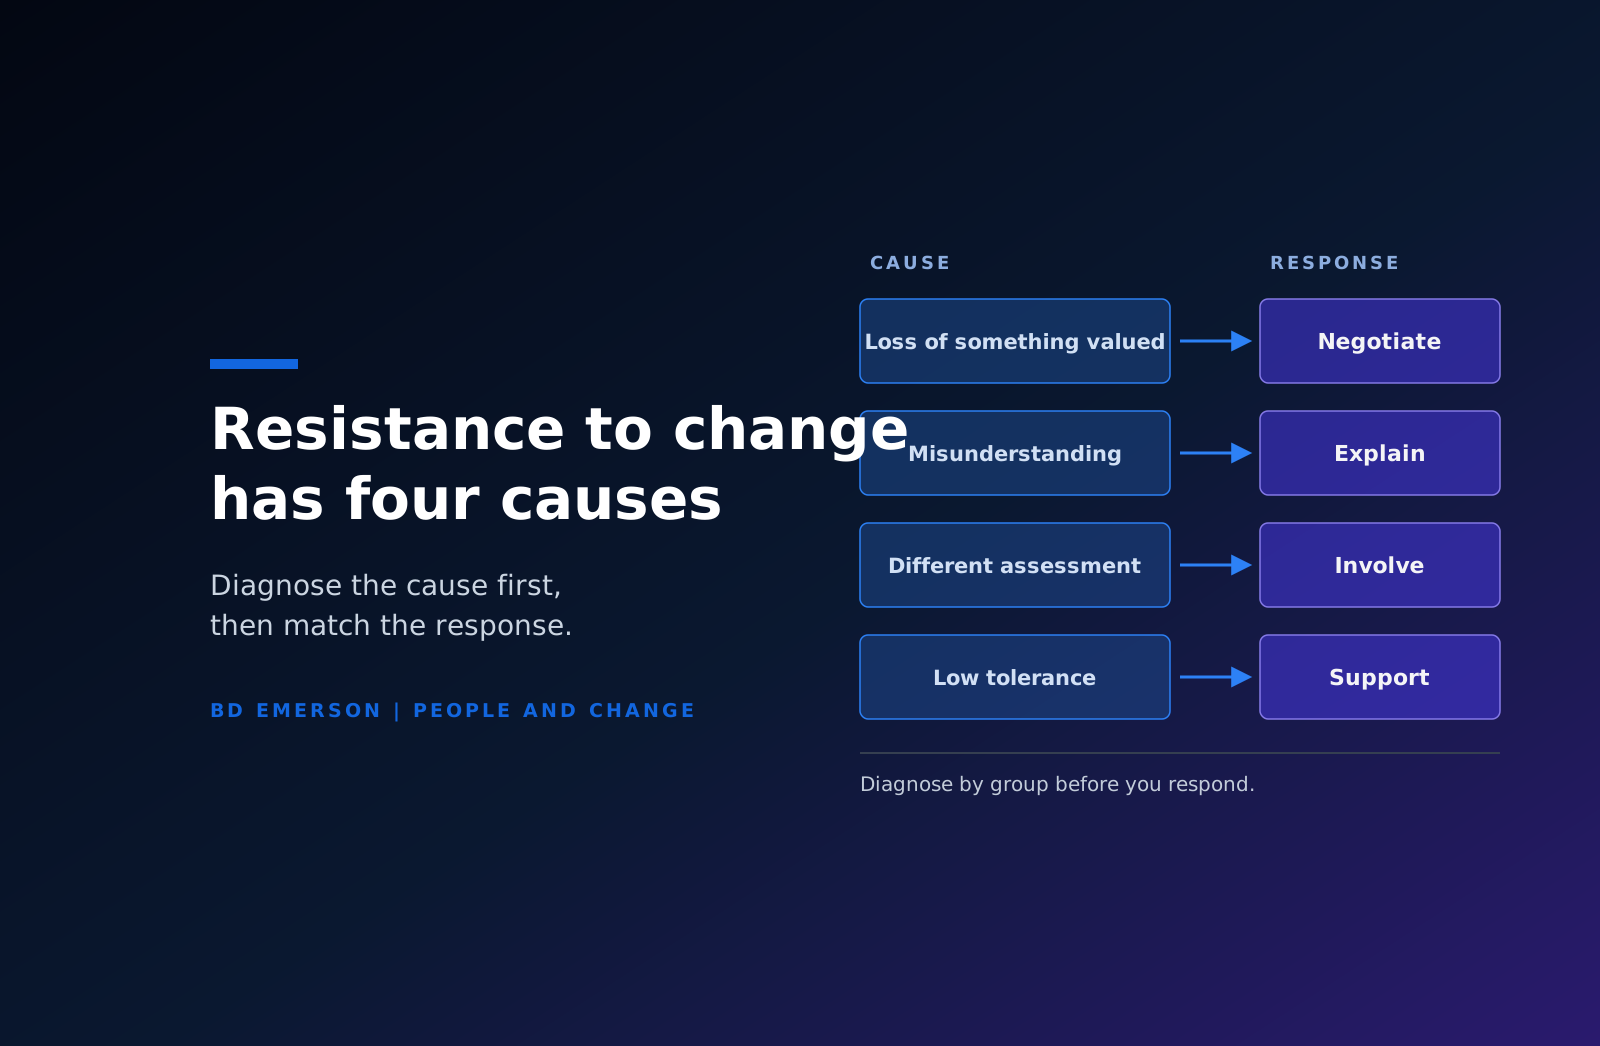
The curve is also the wrong lens when the pushback concerns the design of the change. An objection that the new process adds three steps to every order is a claim about the process, and the right response is to test it. Treating that objection as a stage of grief loses information the program needs.
BD Emerson plans and runs the people side of major change with our Andersen Consulting colleagues at Daniels Consulting Group, a firm of organizational psychologists and experienced business professionals. Our change management consulting service builds the readiness assessment, sponsor plan, communications, training, and adoption measures that carry people through the dip. Book a consultation to discuss the change ahead of you.

About the author