Cybersecurity Metrics and KPIs for Board Reporting: What to Track and How to Report
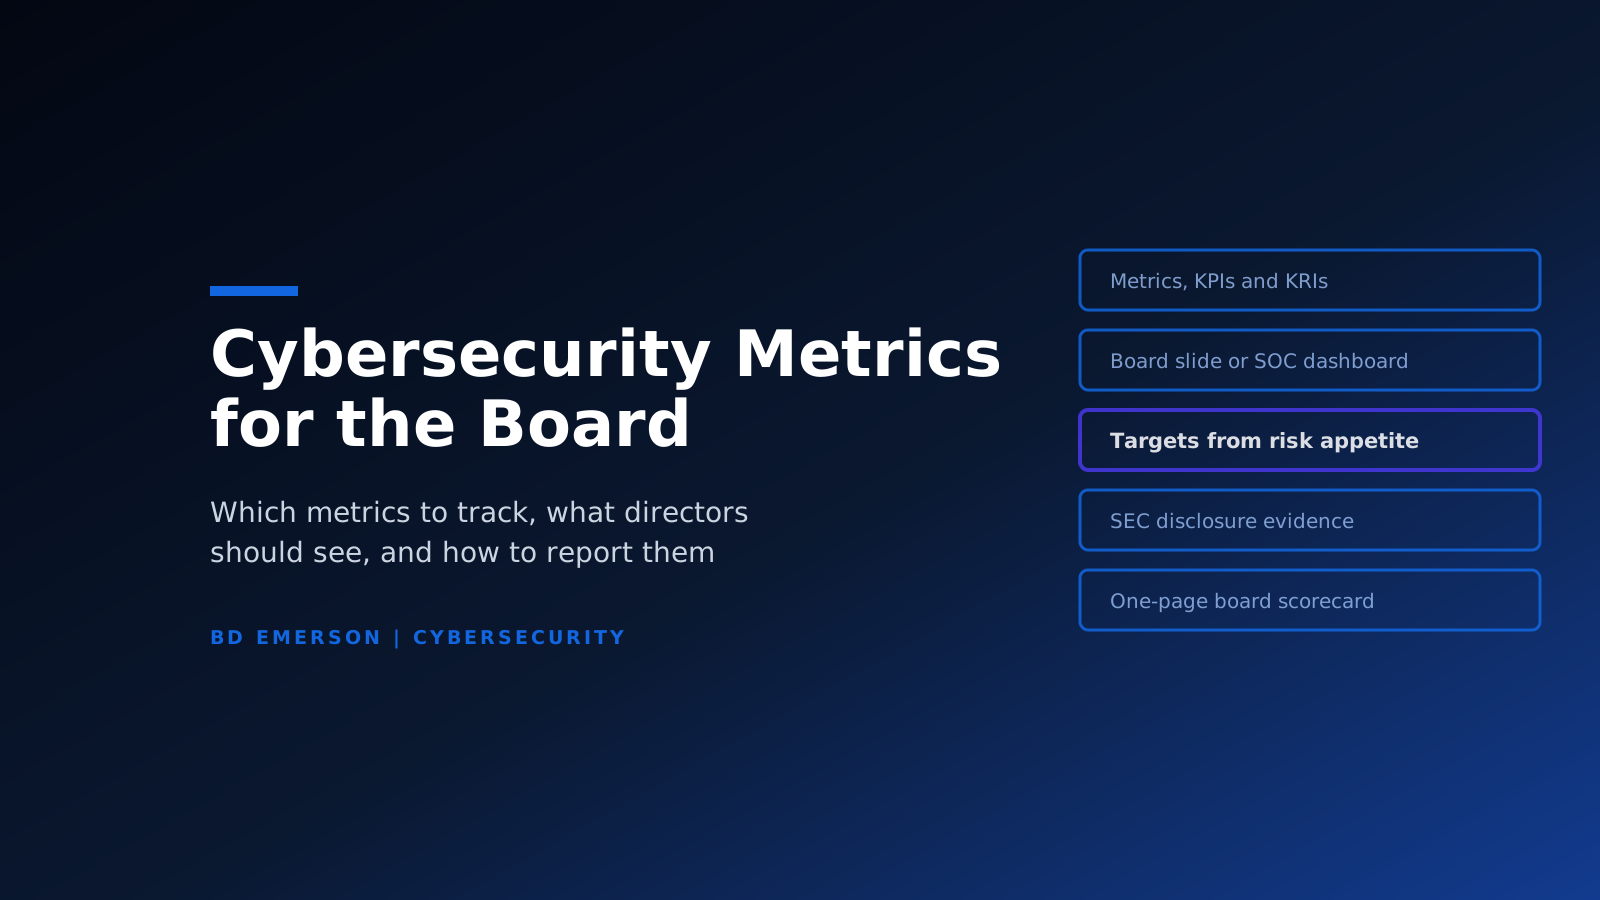
A board needs only the few cybersecurity metrics that show a material risk against a limit it has approved; the rest belong in the management report or on the security operations center (SOC) dashboard. The National Association of Corporate Directors (NACD) and the Internet Security Alliance draw the same line in their 2026 Director's Handbook: the board's focus "should remain on strategic indicators," and translating technical data into business terms is management's job.
Choosing them comes with a date attached: the next board meeting, and a director asking why the last deck held dozens of numbers and no decision. Security tools produce counts of alerts, blocked intrusion attempts, patches, and phishing results. None of them comes labeled as a metric, a key performance indicator (KPI), or a risk indicator, so the pack mixes activity with risk.
For a public company the pack is also evidence: the SEC's 2023 cybersecurity disclosure rules have the annual report describe how the board oversees cybersecurity risk. Cyber risk is a board matter in practice as well: NACD makes measuring and reporting it one of the six principles in the 2026 handbook.
Choosing cybersecurity metrics for the board falls to three people. One is the CFO or CEO of a mid-size company with a quarterly cyber update to give. Another is the chief information security officer (CISO) or virtual CISO (vCISO) who builds the deck. The third is the leadership of a private company that answers to investors, insurers, and enterprise customers.
Key takeaways
- Only a few metrics belong on the board page. A metric reaches the board when it tracks a material risk, has a threshold the board approved, and reads without a translator; the rest stay with management or in the SOC.
- Metric, KPI, and KRI are different things. In NIST's terms a KPI measures progress toward what the program set out to do and a key risk indicator (KRI) measures risk; without a target or an appetite behind it, each is just a number.
- Every definition should come from a published source. NIST defines the detection and recovery clocks; IBM's 247-day breach lifecycle for 2026 covers identification and containment, so it is not a detection figure.
- Targets start from the board's risk appetite. Until the board sets one, figures from NACD and the Cybersecurity and Infrastructure Security Agency (CISA) can serve as provisional thresholds; CISA's Binding Operational Directive (BOD) 26-04, though, binds federal civilian agencies only.
- The board pack doubles as disclosure evidence. Item 106 asks the annual 10-K to describe board oversight of cyber risk, and the Form 8-K Item 1.05 clock runs four business days from the materiality determination.
What are cybersecurity metrics?
Cybersecurity metrics are measures tied to a target, used to track progress and support decisions about a security program. NIST's measurement guide, SP 800-55 Volume 1, was published in December 2024. NIST keeps three words apart:
- Measurement is "the process of obtaining quantitative values."
- Measures are the values it produces.
- Metrics are "Measures and assessment results designed to track progress, facilitate decision-making, and improve performance with respect to a set target."
The difference is practical. The number of phishing emails a gateway blocked is a measure; the share of employees who clicked a simulated phish, set against the rate the company agreed to accept, is a metric.
NIST's companion volume, SP 800-55 Volume 2, names the "major challenge" of security measurement as "translating technically measurable performance data into a form that is contextually relevant to the consumer of the report." Cybersecurity metrics defined once, from a published source, keep that translation the same from one board meeting to the next.
The four types of security measures
SP 800-55 sorts measures into four types, and the type says a good deal about who should see a number:
- Implementation measures track the progress of specific security controls and "are usually demonstrated in percentages," such as the percentage of systems with approved system security plans or of servers with a standard configuration. NIST calls them "a record of what exists and what needs improvement," and we would place compliance metrics here.
- Effectiveness measures "evaluate how well implementation processes and controls are working and whether they are meeting desired outcomes." They answer whether a security control changes the result.
- Efficiency measures examine timeliness, "how quickly those issues are addressed." We would place mean time to detect and time to remediate here.
- Impact measures quantify the effect of security on the mission: costs incurred from addressing events, regulatory fines, contractual penalties, and business value gained or lost. NIST notes that they "are sought by executives" and that results need further analysis "not dissimilar to normalization" before a non-technical audience sees them.
The type is a hint about who needs a number, not a filter. Implementation and efficiency measures stay inside the security program unless they track a control the board relies on, as multi-factor coverage and the age of critical vulnerabilities do. Impact measures, and effectiveness measures tied to a named risk, are the ones a director weighs most directly.
What is a cybersecurity KPI? KPIs vs metrics vs KRIs
A cybersecurity KPI is a metric that measures progress toward an intended result, and a KRI is a metric that measures risk. Both definitions are NIST's. A key performance indicator is "a measure of progress toward intended results," and a key risk indicator is "a metric used to measure risk." Both are kinds of metrics, "though not all metrics fall into these categories." The table sets the three side by side.
Table 1. Metric, KPI, and KRI compared
| Metric | KPI | KRI | |
|---|---|---|---|
| Definition (NIST SP 800-55) | Measures and assessment results that track progress, support decisions, and improve performance against a set target | A measure of progress toward intended results | A metric used to measure risk |
| Question it answers | Is this measure moving toward its target? | Is the program doing what it committed to? | How exposed is the company? |
| Example | Percentage of systems with approved system security plans | Mean time to remediate critical vulnerabilities, against the agreed limit | Third-party risk concentration and exposure levels |
| Who reads it | Security teams and control owners | Management; the board when it tracks a board objective | The board, against its risk appetite |
Sources: NIST SP 800-55 Vol. 1, Sec. 1.4 and Sec. 4; NACD-ISA 2026 Director's Handbook, Principle 5; read September 2026.
Note. The question and reader rows are our reading of the definitions.
The definitions carry a consequence. A KPI with no target is only a metric, since progress needs a result to aim at. A KRI with no risk appetite behind it is only a number, since nobody has said how much of that risk is acceptable.
NIST CSF 2.0 puts both into the executive conversation: practitioners give managers and executives key performance indicators and key risk indicators, the information "they need to understand the organization's cybersecurity posture," so that the risk strategy can be adjusted. For example, a cyber security KPI in a board pack can be the patching or detection clock the program committed to. The KRI beside it then measures the risk that clock is meant to keep within the board's appetite. Label both.
Cyber security metrics examples: 20 metrics and KPIs with definitions and formulas
The 20 rows below run from detection and incident response to money and governance. Each of the cyber security metrics examples in the table is named or defined by a primary source, and the calculation column turns each definition into a number you can reproduce every quarter; the last column gives its NIST type. The table is for whoever builds the pack; a director can go straight to the three-question test that follows it.
Table 2. 20 cybersecurity metrics with definitions and calculations
| Metric | What it measures | How to calculate | NIST type |
|---|---|---|---|
| Mean time to detect (MTTD) | "The average amount of time that a problem exists before it is found" (NIST) | For each incident, time found minus the earliest evidence of the problem; sum, divide by the number of incidents, and show the median beside it | Efficiency |
| Mean time to recovery (MTTR) | "The average amount of time it takes to recover from a product or system failure" (NIST) | For each outage or incident, time service was restored minus time it failed; average over the period, median beside it | Efficiency |
| Time to identify and time to contain | The two breach clocks in IBM's Cost of a Data Breach Report 2026, mean time to identify (MTTI) and mean time to contain (MTTC), which together make the breach lifecycle | Identification minus the start of the breach; containment minus identification; keep the two apart on the report | Efficiency |
| Number and severity of incidents over time | A key risk indicator in NACD's Principle 5; NIST names the number of security incidents in a year as a program-level metric | Incidents per quarter by the company's own severity scale, shown as a trend | Effectiveness |
| Cost of security incidents | A NIST impact measure: costs incurred from addressing security events, with regulatory fines and contractual penalties listed beside it | Sum per period of response costs, regulatory fines, and contractual penalties, incident by incident | Impact |
| Mean time to remediate a vulnerability | Gives "more precise insight into patching efficiency" than the count patched in a year (NIST) | For each vulnerability, fix date minus discovery date, by severity; average and median | Efficiency |
| Critical vulnerabilities older than 30 days | An example metric under "Hygiene" in NACD's board reporting tool | Open critical vulnerabilities past 30 days, divided by all open critical vulnerabilities | Efficiency |
| Known exploited vulnerabilities on internet-facing systems | CISA's example of a well-formed goal in its Cybersecurity Performance Goals 2.0: no internet-facing system with a known exploited vulnerability (KEV) | Internet-facing assets with a vulnerability listed in CISA's KEV catalog | Effectiveness |
| Critical assets with multi-factor authentication | NACD example metric under "Exposure" | Critical assets enforcing multi-factor authentication, divided by all critical assets | Implementation |
| Phish click rate | NACD example metric under "Culture"; in the Verizon 2026 DBIR, the median simulation click rate in mobile-centric vectors such as voice and text is 40% higher than via email | Users who clicked in a simulation, divided by users tested; email, voice, and text apart, with the report rate of the simulated phish beside it | Effectiveness |
| Security training completion | NACD key risk indicator; NIST advises completion rates and quiz results over "low, medium, or high" labels | Employees who completed required cybersecurity awareness training, divided by employees required to take it; add quiz results | Implementation |
| Vendors with a current SOC 2 Type 2 report | NACD example metric under "Third Party" | In-scope vendors with an unexpired SOC 2 Type 2 report, divided by all in-scope vendors | Implementation |
| Vendors with cybersecurity SLAs | NACD example metric under "Third Party" | Vendors whose contracts carry cybersecurity service levels, divided by all in-scope vendors | Implementation |
| Third-party risk concentration | NACD key risk indicator: "third-party risk concentration and exposure levels" | Critical services or data sets that depend on a single vendor, with the exposure attached to each | Impact |
| Sensitive data classified and inventoried | NACD example metric under "Data Security," covering PII, PHI, and financial data | Sensitive data stores classified and in the inventory, divided by known sensitive data stores | Implementation |
| False positive rate | "The proportion of positive reports that were incorrectly identified" (NIST) | Alerts from security monitoring tools closed as false positives, divided by all security alerts generated and triaged in the period | Effectiveness |
| Quantified risk exposure by business unit | NACD key risk indicator | Expected loss per business unit, from the company's standardized method for calculating risk (CSF 2.0 GV.RM-06) | Impact |
| Annual loss expectancy (ALE) | "The annual monetary loss that can be expected from a specific risk on a specific asset" (ENISA) | ALE = ARO × SLE, with the company's own inputs (see below) | Impact |
| Return on security investment (ROSI) | ENISA's ratio of the loss a control removes, net of its cost, to that cost | ROSI = (monetary loss reduction - cost of the solution) / cost of the solution | Impact |
| Exposure against the board-approved risk appetite | NACD dashboard item; appetite and tolerance statements are CSF 2.0 outcome GV.RM-02 | Current exposure of each top risk scenario next to its approved appetite limit, flagged when above | Impact |
Sources: NIST SP 800-55v1 and CSF 2.0; NACD 2026 handbook; IBM 2026; Verizon DBIR 2026; CISA CPG 2.0; ENISA ROSI; read September 2026.
Note. The calculation and type columns are our reading of each definition.
How to measure time-based metrics
Time-based metrics need three decisions written down before the first report:
- Which clock. SP 800-55 defines two of the clocks, mean time to detect and mean time to recovery. Mean time to respond and mean time to contain have no definition in either volume of SP 800-55, so a report that uses them has to define them itself.
- Which average. NIST defines the mean as "the sum of the data points divided by the number of data points," and the median as the point with half the data smaller and half larger. One incident that stays open for months moves the quarter's mean and barely moves the median. Report the median or both, and label which one the board page shows.
- Where the clock starts. Detection time counted from the first alert and detection time counted from the earliest evidence in the investigation are two different metrics. Choose one, write it into the definition, and keep it.
IBM measures a security breach with two clocks of its own. In its 2026 data the mean time to identify a breach was 183 days and the mean time to contain it 64 days, and IBM gives the full lifecycle as 247 days. The 247 days is identification and containment together, not detection time. IBM also reports that breaches with lifecycles longer than 200 days cost USD 5.65 million on average, against USD 4.32 million for shorter ones.
Where a provider runs part of your incident response, its service levels may stop at notification. Our comparison of MDR, SOC as a Service, and MSSP shows where the provider's clock stops and time to contain becomes the company's own.
How to calculate ALE and ROSI
ALE and ROSI put a security metric into money, the unit the finance side of a board already reads. ENISA's Introduction to Return on Security Investment defines the inputs. The single loss expectancy (SLE) is "the expected amount of money that will be lost when a risk occurs." The annual rate of occurrence (ARO) is "a measure of the probability that a risk occurs in a year." The formulas are in the table above; in ROSI, the monetary loss reduction is the ALE without the control minus the ALE with it.
The inputs are yours, and ENISA calls the loss and mitigation inputs estimations that make ROSI "more approximate," so security investments reach the board with their assumptions printed beside the result. Our guide to calculating compliance ROI works through the inputs step by step, including how to use documented risk data for the ARO.
Board slide or SOC dashboard? A three-question test
A metric earns its place on the board page only when it passes three questions. A metric that fails one stays on the management report or the SOC dashboard, where it still has a job, and each question assumes a yes to the one before it.
Figure 1. The three-question test for a board metric
Source: our test, built on NIST SP 800-55v1, CSF 2.0, NACD Principle 5, and SEC Release 33-11216.
Each question rests on a source:
- Question 1, from NIST. SP 800-55 asks whether a data point "directly illustrates the performance of a valid control or tracks the presence of a material risk," and if not, says "it may be best to exclude" it.
- Question 2, from the board's appetite. CSF 2.0 calls for risk appetite and risk tolerance statements, and NACD's Principle 5 dashboard shows "current exposure against the board-approved risk appetite." Without an approved threshold, a change in the number triggers nothing.
- Question 3, from the SEC and NACD. The SEC dropped a proposed disclosure of board members' cybersecurity expertise, finding that directors with broad-based skills in risk management and strategy "often effectively oversee management's efforts without specific subject matter expertise." NACD puts the translation on management.
Applied to the metrics of Table 2, the test gives these verdicts.
Table 3. Where each of the 20 metrics belongs
| Metric | Where it belongs | The board-level version |
|---|---|---|
| Mean time to detect | Board | Median days to detect incidents above the agreed severity |
| Mean time to recovery | Board | Median time to restore critical services; shares the detection and recovery line |
| Time to identify and time to contain | Management report | Feeds the detection and recovery line |
| Number and severity of incidents | Board | Incidents at or above escalation severity, with the trend |
| Cost of security incidents | Board | Quarterly cost in dollars; shares the incident line |
| Mean time to remediate a vulnerability | Management report | Feeds the critical-vulnerabilities line |
| Critical vulnerabilities older than 30 days | Board | Share open past the approved limit |
| KEVs on internet-facing systems | Board | Exposed systems with a KEV, against the board's threshold (zero in CISA's example) |
| Critical assets with multi-factor authentication | Board | Share covered, against the approved target |
| Phish click rate | Management report | Reaches the board if a top risk scenario starts with phishing |
| Security training completion | Management report | Exceptions against the target only |
| Vendors with a current SOC 2 Type 2 report | Management report | Feeds the third-party line |
| Vendors with cybersecurity SLAs | Management report | Feeds the third-party line |
| Third-party risk concentration | Board | Critical services that rest on one vendor, with the exposure |
| Sensitive data classified and inventoried | Management report | Reaches the board when coverage falls below target |
| False positive rate | SOC dashboard | Tells the SOC which detections to tune |
| Quantified risk exposure by business unit | Board | Shares the appetite line |
| Annual loss expectancy | Board | ALE per top risk scenario, with its assumptions |
| Return on security investment | Management report | Reaches the board with major investment requests |
| Exposure against the board-approved risk appetite | Board | The headline line of the board page |
Note. The verdicts are ours; a board with other thresholds will place some rows differently.
The board rows fold into eight lines on the board page, because three pairs share a line. Detection goes with recovery, incident count with incident cost, and exposure by business unit with the appetite line. A metric that passes the first question but only feeds one of those lines, matters in one named scenario, or matters only when it breaks its target stays on the management report. It reaches the board through the line it feeds or when its trigger fires.
Only the false positive rate stays on the SOC dashboard, where the security operations team tunes detections. Our SOC as a Service monthly operating review reports numbers of that kind, including alert volume, true and false positive rates, and time to triage.
Board members see the supporting security metrics only through the eight lines, and that is deliberate: NIST's advice on quantitative metrics is that "less is often more," and NACD's objective "is not to drown the board in data." Each line ties to a decision, to accept a risk or to allocate resources to reduce it.
Cybersecurity metrics for the board: what directors should see
Directors should see a short set of metrics, eight lines in our template, that answer the five questions NACD's 2026 handbook uses for board-level metrics. Each question below names the metrics that answer it, all defined in Table 2:
- What is the threat environment we face? Number and severity of incidents over time, and known exploited vulnerabilities on internet-facing systems. We put exposed KEVs on this line because exploitation of vulnerabilities is now the most common initial access vector for breaches in Verizon's 2026 DBIR, at 31%. Emerging threats and the wider threat landscape belong in the memo that travels with the numbers.
- What is our cyber loss exposure in economic terms? Exposure against the board-approved risk appetite, and ALE for the top risk scenarios. NACD writes that boards and regulators "expect management to quantify cyber risk in economic terms, using credible models."
- What is our cyber-risk profile? Critical vulnerabilities older than 30 days, critical assets with multi-factor authentication, and the detection and recovery line.
- What is our supply chain exposure? Third-party risk concentration, with vendor SOC 2 Type 2 coverage beneath it. In the same DBIR, breaches with third-party involvement reached 48% of total breaches.
- Are we making the right business and operational decisions? No standing line: ROSI travels with major investment requests, and the "estimated cyber loss exposure associated with major business initiatives" that NACD asks about goes into the memo.
NACD's Principle 5 asks that the reports align with the company's enterprise risk management (ERM) process. They should use "the same language, cadence, and metrics used for other forms of material risk." In practice that puts cybersecurity risks in the enterprise risk register on the same likelihood and impact scales as credit or operational risk, so a director can compare them on one page.
Where targets for board metrics come from
Targets for board metrics start from the board's risk appetite; published numbers only help turn that appetite into a threshold. CSF 2.0 asks for risk appetite and risk tolerance statements that are "established, communicated, and maintained." A threshold the board approves is that statement written as a number: the level at which the board wants to hear about a metric.
Published numbers come in three kinds: binding rules, public yardsticks, and peer examples. None of them replaces the appetite. Four sources give usable starting points:
- NACD's example targets (peer examples). The handbook's board reporting tool pairs its example metrics with example targets, such as more than 98% of critical assets with multi-factor authentication and under 5% of critical vulnerabilities older than 30 days. For vendors, its examples are over 90% with cybersecurity SLAs and over 90% with a current SOC 2 Type 2 report. For people and data, they are a phish click rate under 2% and over 95% of sensitive data classified and inventoried.
- CISA BOD 26-04 (a binding rule for federal agencies, a public yardstick for everyone else). Binding Operational Directive 26-04, issued June 10, 2026, binds federal civilian agencies and does not apply to contractors unless a procurement contract says so. The directive's Table 1 runs from 3 calendar days, for a publicly exposed vulnerability in the KEV catalog that an adversary can automate, to 60 days, and leaves some low-risk cases to the next system upgrade. It superseded BOD 22-01, and agencies have 180 days from issuance to meet the new timelines.
- CISA CPG 2.0 (a public yardstick, voluntary). CPG 2.0 asks for a vulnerability management program to "patch and mitigate misconfigured software in a timely manner," without naming a number of days. As its example of a well-formed goal, CISA gives "ensuring that none of an organization's internet-facing systems have any known exploited vulnerabilities (KEVs)," which makes zero the natural threshold for that line. CISA wrote the goals to be accessible to "senior executives and board members," and they are voluntary.
- Verizon DBIR 2026 (a peer example, observed). Only 26% of critical vulnerabilities in the CISA KEV catalog were fully remediated in 2025, and the median time to full resolution was 43 days. The figure shows where organizations in Verizon's dataset stand, not where a target should sit.
A board with no approved appetite yet can start from NACD's examples and CISA's figures as provisional thresholds, proposed by management and approved at the next meeting, and revise them once its first appetite statement is in place. For detection and recovery, where none of these sources gives a yardstick, the company's own median over the last four quarters is the starting point. Tighten a threshold once the metric holds inside it; what happens when a line crosses one is set by the escalation rules under "Reporting cybersecurity to the board."
How board metrics support SEC cybersecurity disclosure
For a public company, the cybersecurity metrics its board sees are part of a process the SEC asks the company to describe. Regulation S-K Item 106 requires the annual report on Form 10-K to describe the board's oversight of cybersecurity risk.
The rule's next sentence reads: "If applicable, identify any board committee or subcommittee responsible for the oversight of risks from cybersecurity threats and describe the processes by which the board or such committee is informed about such risks." Where a group of directors carries that oversight, the company names it and describes how the board or that group is kept informed. The rule asks for processes, not metrics.
Table 4. Board metrics mapped to the SEC disclosure items
| Disclosure item | What it asks | Metrics that support it |
|---|---|---|
| Item 106(b)(1) | Processes "for assessing, identifying, and managing material risks from cybersecurity threats" | Exposure against the appetite; ALE for the top scenarios |
| Item 106(b)(1)(ii) and (iii) | Third parties engaged in those processes; oversight of third-party service provider risk | Vendor SOC 2 Type 2 coverage; vendor SLAs; third-party concentration |
| Item 106(c)(1) | The board's oversight and, where a group of directors carries it, "the processes by which the board or such committee is informed" | The board scorecard, its calendar, and the escalation rules |
| Item 106(c)(2)(ii) | How management monitors "the prevention, detection, mitigation, and remediation of cybersecurity incidents" | Prevention: multi-factor authentication coverage, exposed KEVs. Detection: MTTD. Mitigation: time to contain, MTTR. Remediation: time to remediate, aged critical vulnerabilities |
| Form 8-K Item 1.05 | An incident's "nature, scope, and timing" and its material impact | Incident severity and cost; when each materiality decision was made |
Sources: 17 CFR 229.106; SEC Release 33-11216 (Form 8-K Item 1.05); read September 2026.
Note. The metrics column is our mapping, not a list the SEC publishes.
Form 8-K Item 1.05 runs on a different clock, and it starts at the materiality determination, not at discovery. The Item 1.05 report is due "within four business days after the registrant determines that it has experienced a material cybersecurity incident," and the determination "must be made without unreasonable delay after discovery of the incident." The rule leaves the choice of decision-maker to company policy, so the incident line on the board page should record when each materiality decision was made.
Figure 2. SEC disclosure clocks beside the board's reporting cycle
The SEC dropped a proposed requirement to disclose how often the board discusses cybersecurity. It noted, however, that a company describing quarterly presentations by its chief information security officer may note their frequency, so a board reporting calendar is something the 10-K can describe.
Status as of September 2026:
- Item 1.05 and Item 106: in force. A joint petition for rulemaking asks the SEC to rescind Item 1.05. In January 2026 the SEC Chairman instructed staff to review Regulation S-K; neither step has changed the rules.
- CIRCIA: its 72-hour incident reports for critical infrastructure are not yet required, because CISA is still working on the final rule.
Private companies sit outside the rule. When insurers or enterprise customers ask how the board oversees cyber risk, the third-party and board-oversight rows of the map give the answer.
Reporting cybersecurity to the board: cadence, format, and escalation
The board should hear about cyber risk on a fixed calendar, with escalation rules agreed before they are needed. NACD's Principle 5 sets the floor for reporting cybersecurity to the board: such reporting "should occur at least quarterly and immediately following any material incident or significant change in risk exposure." The handbook's example cadence has three report types:
- Standing brief at every board meeting. A two-page executive memo plus a dashboard, for trend analysis and resource needs.
- Quarterly deep dive. A thirty-minute workshop on strategy, emerging threats, and budget alignment.
- Material-incident update. NACD suggests one within 24 hours of the materiality determination, as a one-page incident sheet with a follow-up call. That 24-hour window is NACD's suggested board practice; the legal deadline is the four-business-day Form 8-K clock.
Write the board escalation rule into the company's security policies first. NACD suggests "formalized escalation criteria" such as "thresholds for financial impact, customer exposure, or operational disruption" that trigger special board updates. Tie each criterion to a line on the board page. An appetite limit crossed, an incident at the top severity, or an exposed KEV above the board's threshold then starts the update without a debate about whether it should. CSF 2.0 closes the loop in its Oversight category, where risk management performance "is evaluated and reviewed for adjustments needed."
Progress on major security initiatives goes into the standing brief as status, beside the cybersecurity metrics rather than in place of them. Keep the metric definitions the same from report to report (see "What makes a board cybersecurity metric misleading"). Our guide to the first 90 days with a fractional CISO sets a monthly metrics pack and a board summary as day-90 deliverables.
A one-page board scorecard template
Each row of a one-page board scorecard carries one board line, and its columns give a director what is needed to judge it. The template below holds the eight board lines from the test above, with the source and threshold for each.
Table 5. One-page board scorecard template
| Metric | Definition and source | Board threshold |
|---|---|---|
| Exposure against the risk appetite | Top risk scenarios against their appetite limits (NACD Principle 5; CSF 2.0 GV.RM-02) | Appetite limit per scenario, set by the board |
| ALE for the top risk scenarios | ARO × SLE (ENISA) | Within the appetite limit |
| Incidents at or above escalation severity, with cost | NACD key risk indicator; NIST impact measure | Escalation threshold agreed in advance |
| Detection and recovery: MTTD and MTTR, median | NIST SP 800-55 | Set by the board, one for each |
| Critical vulnerabilities older than 30 days | NACD example metric | NACD example: under 5% |
| Internet-facing systems with a KEV | CISA CPG 2.0 example goal | Zero (CPG 2.0 example); BOD 26-04 as a public yardstick |
| Critical assets with multi-factor authentication | NACD example metric | NACD example: over 98% |
| Third-party risk concentration | NACD key risk indicator | Set by the board |
Sources: NACD 2026 handbook; NIST SP 800-55v1 and CSF 2.0; CISA CPG 2.0 and BOD 26-04; ENISA ROSI; read September 2026.
In your own template, add columns for this quarter, last quarter, a four-quarter trend, the owner, and the decision requested from the board.
The page shows the organization's security posture against limits the board chose. Threat trends and remediation progress, which NACD's Principle 5 also puts on the board dashboard, go into the two-page memo beside it. Three habits keep the page readable:
- One number per row. A row with two numbers invites a debate about which one matters. Where two metrics share a line, as detection and recovery do, show them as a pair with a threshold for each.
- A trend of at least four quarters. A single quarter shows a level, not a direction. Four quarters show whether the line is moving toward its threshold or away from it, and they build toward the year-over-year view NACD asks for.
- One explicit decision per page. Name the one decision the board is asked to take this quarter: accept a risk, fund a remediation, or change a threshold. Leave the decision column empty on rows that need none. A page with no decision is a status update.
What makes a board cybersecurity metric misleading
A board metric misleads when it looks like a measure of risk but measures something else. Eight failure types are worth checking before a pack goes out:
- Activity counts presented as outcomes. Intrusion attempts blocked, failed login attempts, and alerts from intrusion detection systems count what security tools saw; a count of endpoints with antivirus software installed is an implementation measure. Neither kind says whether risk fell. NIST draws the same line for patching, where mean time to remediate says more than "simply knowing the number of vulnerabilities patched in a year."
- A mean reported without saying so. One long incident can move a quarterly mean; label the average.
- A lifecycle read as detection time. Where a detection line quotes IBM for comparison, the comparable figure is the 183-day mean time to identify for 2026, not the 247-day lifecycle that adds containment to it.
- A global average used as the company's own loss. IBM's 2026 global average cost of a data breach, USD 4.99 million, is an average across the organizations in its study. ENISA is plain that "There are no universal values for SLEs," so the ALE on the board page uses your own inputs.
- A framework tier presented as a maturity score. CSF 2.0 Tiers "characterize the rigor of an organization's cybersecurity risk governance and management practices," and NIST says they "should complement an organization's cybersecurity risk management methodology rather than replace it." Our guide to the security maturity assessment explains how to score maturity by domain instead.
- Superseded references. A patch threshold that still cites the revoked BOD 22-01, or a breach figure taken from an earlier edition of an annual report.
- Definitions that change between quarters. NIST's reason for consistency is that "By keeping metrics consistent over time, organizations can evaluate long-term trends and expected ranges." A new clock start or a new severity scale breaks the trend; when a change cannot wait, show the old and the new definition side by side for one quarter.
- False precision. A single-point loss estimate shown with more certainty than its inputs carry, such as an ALE to the dollar built on a guessed ARO.
Any line that shows one of these types is corrected at its definition before the next meeting.
Conclusion
A board sees few cybersecurity metrics by design. Everything else still matters on the management report and the SOC dashboard, where it tells the security team what to fix.
The work comes down to four moves. Define each metric once, with its clock and its average. Put every candidate through the three-question test. Set thresholds from the risk appetite; until the board sets one, NACD's and CISA's figures can serve as provisional thresholds, and Verizon's as a reference point. Report on a calendar the 10-K can describe, with escalation rules written before an incident tests them. Kept constant from quarter to quarter, that pack gives directors a trend they can act on and gives the company a disclosure it can stand behind.
Who Will Present Cyber Risk at Your Next Board Meeting?
BD Emerson offers professional Fractional CISO Services to help your organization put security into board decks in business terms, with metrics executives can act on and a senior CISO who presents to the board. Contact us today to prepare your next board report.

About the author